Comparing Property Valuations: Price Per Square Metre Across UK Regions
By Housey · Last reviewed 9th of May 2026
Comparing Property Valuations: Price Per Square Metre Across UK Regions
Pricing a property accurately is one of the most consequential steps in any purchase or sale. Understanding how price per square metre (£/m²) varies across UK regions gives buyers and sellers a more objective frame of reference than asking price alone — useful when comparing differently-sized properties, when a mortgage valuation comes in below the agreed price, or when assessing whether a neighbourhood is approaching its ceiling. Regional benchmarks are a starting point; they do not replace a formal valuation, but they sharpen the questions worth asking.
Key points
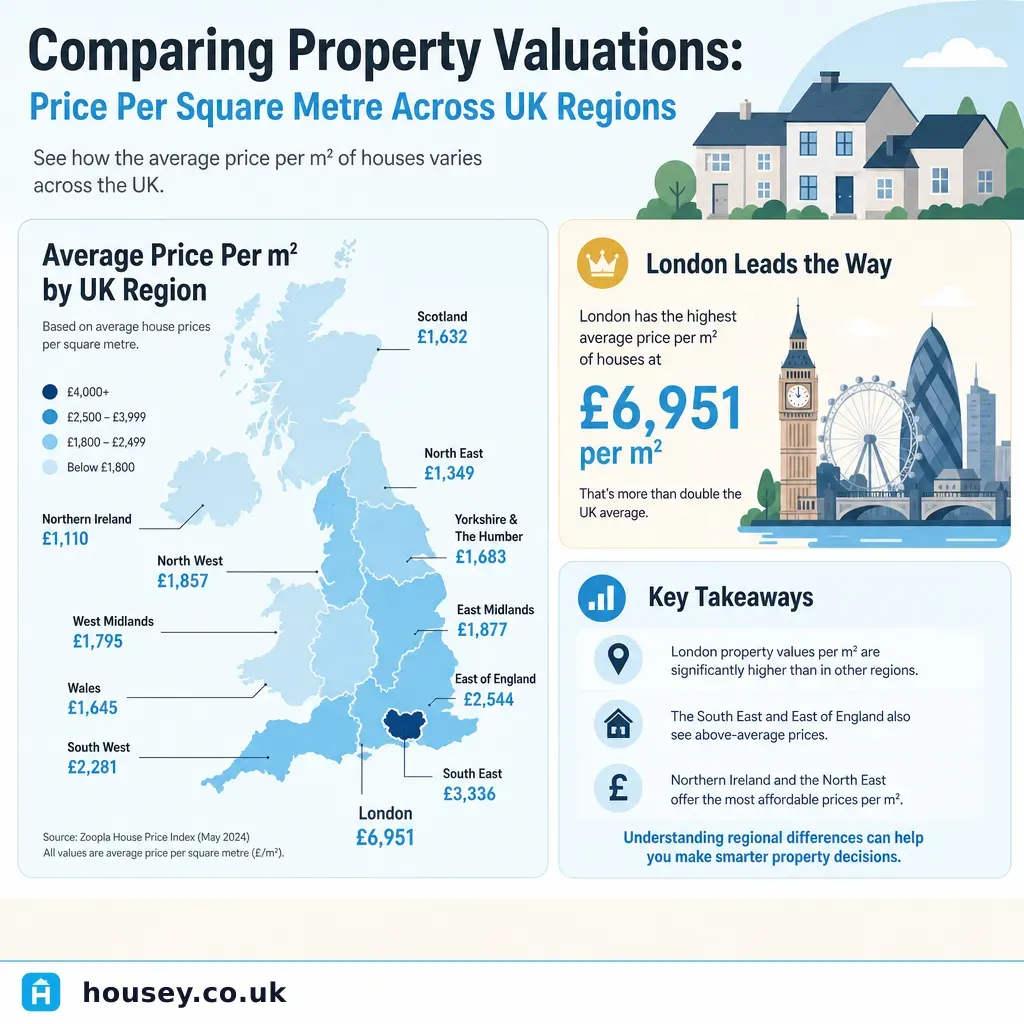
- HM Land Registry Price Paid Data shows median prices ranging from approximately £1,000–£1,800/m² in parts of the North East to more than £10,000/m² in prime central London postcodes.
- RICS Red Book Global Standards govern formal market valuations; a RICS Registered Valuer must assess comparable evidence, condition, tenure, and location before arriving at a figure for a specific property.
- Leasehold flats with fewer than 80 years remaining on the lease often trade at a meaningful discount per m² compared with equivalent freehold houses.
- Gross internal area (GIA) measurements must be consistent when comparing properties; a floor area including a garage or unheated utility room will distort the rate.
- New-build properties typically carry a premium at point of sale that may not sustain on first resale, affecting like-for-like comparisons with existing stock.
How price per square metre is calculated and used
Price per square metre is the transaction price divided by the measured floor area. A £350,000 property with a GIA of 110m² gives approximately £3,180/m².
Estate agents, mortgage valuers, and lenders use comparable sales evidence alongside this metric — it is one input, not a standalone answer. The metric is most useful when:
- Comparing two differently-sized properties on the same street.
- Assessing whether a new-build premium reflects genuine quality.
- Understanding how a valuer has adjusted for size differences between comparables.
- Negotiating a price reduction after a survey reveals material defects.
It is less reliable when properties differ in condition, floor level, aspect, or tenure — all of which affect market value independently of floor area.
Regional price per square metre comparison
The table below draws on HM Land Registry Price Paid Data and ONS UK House Price Index data. Figures are indicative for 2024–2025 and vary by property type, postcode, and condition.
Region | Indicative median £/m² | Notes |
|---|---|---|
London — prime central | £8,000–£15,000+ | Westminster, Kensington & Chelsea |
London — outer boroughs | £4,500–£7,500 | Wide variation across 32 boroughs |
South East (excl. London) | £3,200–£5,000 | Surrey and Berkshire at upper end |
South West | £2,800–£4,200 | Bath and Bristol above regional average |
East of England | £2,800–£4,000 | Cambridge drives the upper end |
West Midlands | £1,800–£2,800 | Birmingham urban areas mid-range |
East Midlands | £1,700–£2,600 | Nottingham and Leicester broadly mid-range |
Yorkshire & the Humber | £1,500–£2,400 | Harrogate and York above regional average |
North West | £1,600–£2,600 | Central Manchester near South East levels |
North East | £1,000–£1,800 | Lowest English regional average |
Wales | £1,400–£2,400 | Cardiff substantially above Welsh average |
Scotland | £1,500–£2,600 | Edinburgh approaches South East figures |
Indicative UK figures, last reviewed 2026-05-09. Source: HM Land Registry Price Paid Data; ONS UK House Price Index. Approximate medians across mixed property types — not a substitute for professional valuation.
What drives variation within a region
School catchments add a verifiable premium to properties within sought-after state school zones, often by a measurable margin within the same postcode district.
Transport access. Proximity to a mainline station or Underground line can add 10–20% according to studies by Lloyds Bank and transport consultancies.
Tenure. Leasehold flats with escalating ground rent clauses, significant service charge liability, or cladding issues frequently trade at a discount per m² compared with freehold equivalents.
Condition and compliance. A property with a recent clear Electrical Installation Condition Report (EICR), a valid Gas Safe certificate, and a strong EPC rating will typically achieve a better rate than one facing significant remedial expenditure. EPC rating increasingly affects lender eligibility.
Property era. Victorian and Edwardian terraced housing in good condition often achieves a premium over 1960s–1980s system-built or concrete-frame stock in the same area.
Worked UK property scenario
A buyer compares two properties in the same Yorkshire market town.
- Property A: 1930s semi-detached, 3 bed, 95m² GIA, asking £265,000 → £2,790/m²
- Property B: 1990s detached, 4 bed, 145m² GIA, asking £385,000 → £2,655/m²
Property B initially appears better value per m². However, a RICS Level 3 Building Survey identifies failing cavity wall insulation, minor roof spread in the loft, and single-glazed windows requiring replacement. Estimated remedial cost: £18,000–£25,000. Adjusted, Property B's effective rate rises to £2,780–£2,825/m² — on par with or above Property A depending on negotiated reduction. Condition was the decisive variable; the headline rate was misleading.
Important limitations
This article provides general comparative data on UK property price trends. The figures are indicative medians from publicly available sources and are not a valuation, mortgage advice, or investment recommendation for any specific property.
Property values depend on site-specific, condition-specific, and tenure-specific factors that regional averages cannot capture. A Registered Valuer operating under RICS Red Book Global Standards is the appropriate professional for a formal market valuation, particularly for mortgage, probate, Help to Buy redemption, lease extension, or legal proceedings. Regulatory requirements vary by lender panel, agency, and court — confirm requirements with the relevant lender, authority, or solicitor.
What to ask a qualified professional
- Are you a RICS Registered Valuer, and is your firm on the relevant lender's approved panel?
- Which comparable sales have you used, and how recent and geographically proximate are they?
- How have you adjusted for differences in condition, size, and tenure between comparables and this property?
- Is this a RICS Red Book market value valuation, or a mortgage valuation prepared for the lender's purposes only?
- What floor-area measurement standard have you used?
- Are there unusual features — short lease, restrictive covenant, cladding, structural concerns — affecting your figure?
When to get professional help
A professional valuation is advisable when:
- You are applying for a mortgage or buying without one and want independent price verification.
- The property has a short lease, unusual construction, cladding, or visible structural defects.
- The transaction involves probate, divorce, shared ownership, Help to Buy redemption, or lease extension.
- A surveyor's report has flagged significant defects and you need to understand the impact on market value.
- The asking price appears materially above or below regional benchmark data.
How Housey can help
Housey connects you with qualified professionals providing valuation surveys and RICS Home Surveys across the UK. Describe your property and receive quotes from vetted, relevant providers without obligation.
Frequently asked questions
How accurate is price per square metre as a valuation guide?
Price per square metre is a useful comparative benchmark but is not a valuation. It cannot account for condition, tenure, planning constraints, or local market conditions at the time of sale. A RICS Registered Valuer working from actual comparable evidence will provide a reliable market value for a specific property.
Where can I find official UK house price data?
HM Land Registry publishes the UK House Price Index monthly, with open data by region, local authority, and property type. The ONS publishes the same data with additional context. Both are free and publicly accessible. Rightmove and Zoopla data reflects asking prices, not completed transactions.
Does price per square metre differ for flats and houses?
Yes. In desirable urban areas, flats often achieve a higher £/m² than houses because smaller units carry a location premium. However, flats with service charges, escalating ground rent, cladding issues, or short leases may trade at a substantial discount. Comparing rates across different property types in the same area requires careful interpretation.
What floor area measurement should I use?
For residential property, RICS Measuring Practice guidance recommends gross internal area (GIA), measured from the internal faces of the external walls. Estate agent floor plans may not use GIA consistently — some exclude loft rooms, conservatories, or garages. Confirm the measurement basis before using any stated floor area in a comparison.
Sources and further reading
- UK House Price Index — HM Land Registry and ONS
- Price Paid Data — HM Land Registry
- RICS Red Book Global Standards — RICS
- ONS UK House Price Index methodology — Office for National Statistics
Useful next reads
 Buying & Moving
How to Get Your Property Professionally Valued
To get a professional property valuation in the UK, instruct a RICS Registered Valuer for any formal purpose — mortgage, probate, Help to Buy, or legal proceedings.
 Buying & Moving
Property Comparables: Using Market Data to Assess Home Value
Property comparables — known as 'comps' — are recently sold properties similar in size, type, tenure, and condition to the one being valued.
 Buying & Moving
Understanding Local Property Values: What Homes Sold For in Your Area
Sold prices for UK properties are publicly recorded by HM Land Registry for England and Wales, Registers of Scotland, and Land and Property Services in Northern Ireland.
 Buying & Moving
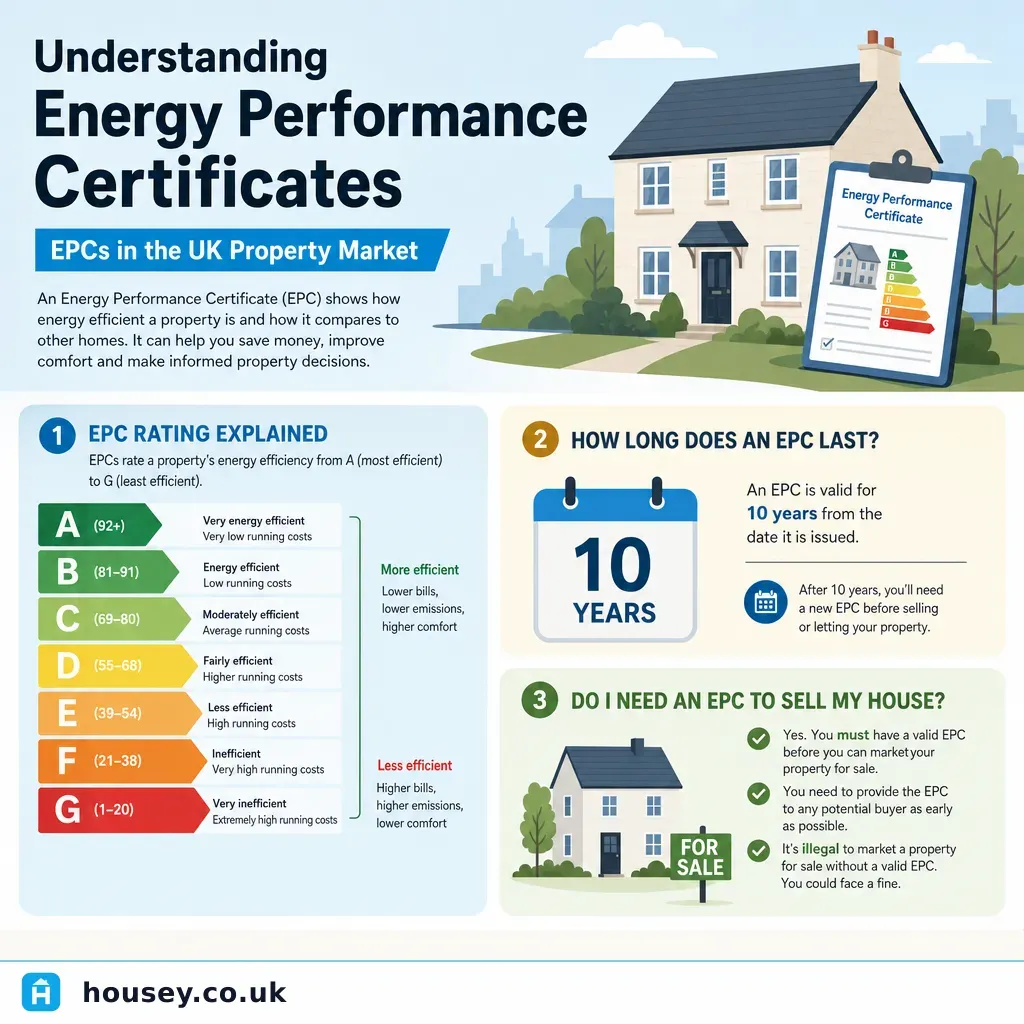
Understanding Energy Performance Certificates: EPCs in the UK Property Market
An Energy Performance Certificate (EPC) rates a property's energy efficiency on a scale from A (most efficient) to G (least efficient).
 Buying & Moving
Determining Your Property's Market Value: Valuation Guide for Sellers
Market value in the UK is most reliably established by combining estate agent appraisals with your own analysis of recent sold prices on the HM Land Registry database.