House Price Analysis: Monthly Market Report and Trends
By Housey · Last reviewed 18th of May 2026
House Price Analysis: Monthly Market Report and Trends
UK house price data is published by several organisations every month, but the figures rarely agree — and for good reason. Each index measures different things, uses different data sources, and reports with a different time lag. For buyers deciding when to offer, sellers setting an asking price, or homeowners assessing their equity position, knowing how to read this data is as important as knowing what it says.
Key points
- The HM Land Registry UK House Price Index (UK HPI) is the official government source for completed residential sale prices, covering all registered transactions in England, Wales, Scotland, and Northern Ireland.
- The ONS House Price Index uses the same underlying Land Registry data and is published monthly with a typical two to three-month reporting lag.
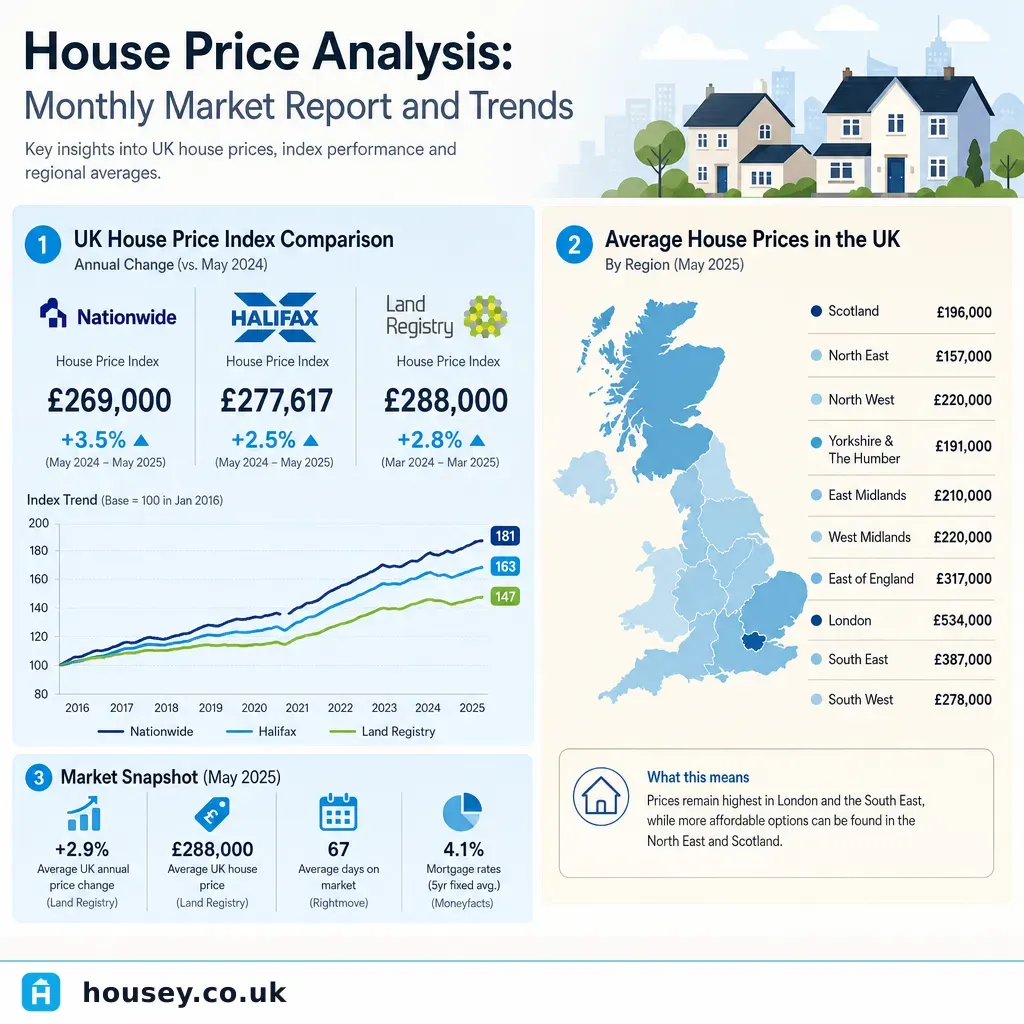
- Lender-based indices from Nationwide and Halifax use mortgage approval data — which is published faster — but exclude cash buyers, who account for a significant share of UK property transactions.
- Average UK house prices vary markedly by region: London and the South East have consistently recorded averages well above the national mean, while the North East, Wales, and Northern Ireland typically sit below it.
- A national or regional average tells you nothing definitive about a specific street or postcode; the price of an individual property depends on its condition, tenure, location, and the negotiation between buyer and seller.
Which house price index should you use?
Four main indices dominate UK coverage. Each has distinct strengths and limitations depending on what you need to know.
Index | Publisher | Data source | Typical lag | Includes cash buyers | Best used for |
|---|---|---|---|---|---|
UK House Price Index (UK HPI) | HM Land Registry / ONS | All completed registered sales | 2–3 months | Yes | Official benchmark; most comprehensive national and regional coverage |
ONS House Price Index | Office for National Statistics | UK HPI data | 2–3 months | Yes | Statistical analysis and long-run regional comparison |
Nationwide House Price Index | Nationwide Building Society | Nationwide mortgage approvals | ~1 month | No | Early monthly indicator of market direction |
Halifax House Price Index | Halifax (Lloyds Group) | Halifax mortgage approvals | ~1 month | No | Early monthly indicator of market direction |
For verified sold prices at address and postcode level, the HM Land Registry Price Paid Data is freely available on GOV.UK for England and Wales, going back to 1995. This shows what individual buyers actually paid — not what sellers asked — and is the most reliable tool for comparing prices on a specific street.
For early market signals, the Nationwide and Halifax indices offer a more timely read, but because they cover only mortgage-funded purchases, they may not fully reflect markets where cash buyers are prevalent, such as the upper price range, some coastal towns, or retirement locations.
Understanding what monthly figures mean — and what they do not
Month-on-month house price movements attract significant media coverage, but a single monthly change rarely indicates a genuine trend. Analysts typically look for three to six consecutive months of movement in the same direction before drawing conclusions about market direction.
Several factors can distort a single month's reading:
- Seasonal patterns: UK property markets see higher transaction volumes in spring and autumn; fewer winter transactions mean monthly averages become more volatile.
- Stamp duty deadline effects: Periods immediately before or after changes to Stamp Duty Land Tax (SDLT) thresholds can dramatically accelerate or suppress transaction volumes for several months, distorting average price data.
- Mix effect: If more high-value or low-value properties happen to transact in a given month, the average moves without any individual property changing in value.
- Reporting lag: A Land Registry figure for a given month reflects sales registered that month — typically agreed one to three months earlier.
Regional price variation across the UK
UK national averages conceal wide regional variation. According to HM Land Registry data, average prices in London and the South East have historically been substantially above the England and Wales average, while average prices in the North East have consistently been among the lowest recorded. Scotland, Wales, and Northern Ireland each publish their own official sold price data through their respective land registries.
This regional spread matters for buyers and sellers alike. A movement in the national average may represent a meaningful shift in one region and an insignificant rounding effect in another. Always contextualise index movements against the specific region — and ideally the specific postcode area — relevant to your decision.
Worked scenario: using sold price data before making an offer
Suppose you are considering making an offer on a three-bedroom semi-detached house in Leeds, listed at £280,000.
- Visit the HM Land Registry Price Paid Data tool on GOV.UK and search for recent sales on the same street or within the same postcode district.
- Filter for comparable properties — similar size, type (semi-detached), and approximate condition — sold within the past 12 months. Sales from two to three years ago may be less relevant given market changes in the interim.
- Check whether those properties sold at, above, or below their listed asking prices. Rightmove and Zoopla display Price Paid Data alongside historical listing prices for many properties, making this comparison straightforward.
- Adjust mentally for condition differences, off-street parking, garden size, and proximity to schools or transport — the data gives context, not a formula.
- If comparable sales suggest a range of £260,000–£270,000, you have a factual basis for a below-asking offer that your conveyancer or estate agent can communicate formally to the seller.
The index tells you the broad direction the market is moving; the Price Paid Data tells you what this type of property on this type of street has been worth to actual buyers in practice.
What not to assume when reading house price data
Common assumption | Why it is misleading |
|---|---|
"The index rose 3% — my home is worth 3% more" | An index measures the average across thousands of transactions in a region. Your property's movement depends on its specific features, condition, and local demand. |
"House prices only go up over the long term" | UK prices have fallen in nominal terms during downturns, notably 2008–09 and the early 1990s. In real, inflation-adjusted terms, falls have been more common and deeper than headlines suggest. |
"The asking price reflects market value" | Asking prices are set by sellers and agents. Verified sold prices — available from the Land Registry — reflect what buyers were actually willing to pay. |
"Different indices should agree" | They measure different datasets with different lags. Divergence between indices is entirely normal; the direction of travel across several months matters more than any single precise figure. |
"A rising index means I should buy quickly" | The relationship between index movements and individual affordability is complex; mortgage rates, lending criteria, and local supply conditions all affect the genuine cost of ownership. |
How to find sold prices in your area
The following resources are free to use and rely on official recorded data:
- HM Land Registry Price Paid Data (GOV.UK): search by postcode, street, or property type for all registered sales in England and Wales from 1995 to the present.
- Registers of Scotland (ros.gov.uk): equivalent sold price data for Scottish properties.
- Land and Property Services Northern Ireland (finance-ni.gov.uk): sold price data for Northern Ireland.
- Rightmove and Zoopla: both overlay Land Registry Price Paid Data on property listings, making it easy to compare listing and sale prices for individual addresses in one place.
When to get professional help
House price data supports decision-making but does not replace professional assessment when the financial consequences are significant. Consider instructing a professional in these circumstances:
- RICS-regulated valuer: if you need a formal, lender-acceptable valuation of a specific property for a mortgage, remortgage, probate, or equity release application.
- Independent financial adviser: if you are assessing how market conditions affect your mortgage options, borrowing capacity, or property investment strategy.
- Estate agent with hyperlocal knowledge: national and regional indices do not reflect street-level variation; an agent who actively sells in your specific postcode area has more granular and current insight than any published index.
How Housey can help
Housey's marketplace helps homeowners connect with RICS-registered valuers, local estate agents, and conveyancing professionals across the UK. If you need a formal property valuation — rather than an index-based estimate — Housey makes it straightforward to compare quotes from accredited local professionals.
Frequently asked questions
Which house price index is most accurate?
No single index is definitively most accurate — they measure different things. The HM Land Registry UK HPI is most comprehensive in coverage, including all registered sales and cash buyers, but it publishes with a two to three-month lag. Nationwide and Halifax are more timely but cover only mortgage-funded purchases. For decisions about a specific property, the Land Registry Price Paid Data for comparable local sales is more useful than any headline index figure.
How do I find out what houses on my street sold for?
The HM Land Registry Price Paid Data tool on GOV.UK allows anyone to search sold prices by address or postcode for properties in England and Wales, going back to 1995, free of charge. Rightmove and Zoopla display this data alongside current listings. For Scotland, use Registers of Scotland (ros.gov.uk); for Northern Ireland, use Land and Property Services Northern Ireland (finance-ni.gov.uk).
Why do the Nationwide, Halifax, and Land Registry figures show different prices?
Each uses a different dataset and methodology. Nationwide and Halifax use mortgage approval data — which excludes cash purchases and leads the Land Registry figure by several weeks. The Land Registry captures all registered sales but with a longer reporting lag. Monthly mix effects — the types of property transacting in any given month — also cause divergence. All indices have analytical value; none tells the complete story independently.
Do house prices fall as well as rise?
Yes. UK house prices fell in nominal terms during the 2008–09 financial crisis and the early 1990s recession. In real, inflation-adjusted terms, periods of stagnation and decline have been more frequent than headlines suggest. Long-run Land Registry and ONS data shows growth is uneven across regions and property types. Anyone basing significant financial decisions solely on long-run trend data should seek independent financial advice.
Sources and further reading
- UK House Price Index — HM Land Registry — Official monthly data for England, Wales, Scotland, and Northern Ireland
- Price Paid Data — HM Land Registry — Searchable sold prices for England and Wales from 1995
- House Price Index — ONS — Statistical analysis of UK residential property prices
- Nationwide House Price Index — Monthly lender-based index with long-run historical data
- Halifax House Price Index — Monthly lender-based index
Useful next reads
 General property advice
Monthly House Price Index: August Market Report and Analysis
The UK House Price Index is published monthly using completed Land Registry transaction data, meaning August figures typically reflect sales agreed months earlier.
 General property advice
Property Market Trends: Activity Growth and Price Movements
UK property market activity is measured through completed sale registrations (HM Land Registry), lender mortgage data, and transaction volumes from HMRC.
 General property advice
Property Type Preferences: Understanding Market Demand
Semi-detached houses consistently attract the highest transaction volumes in England and Wales, making them the most liquid part of the UK market.
 General property advice
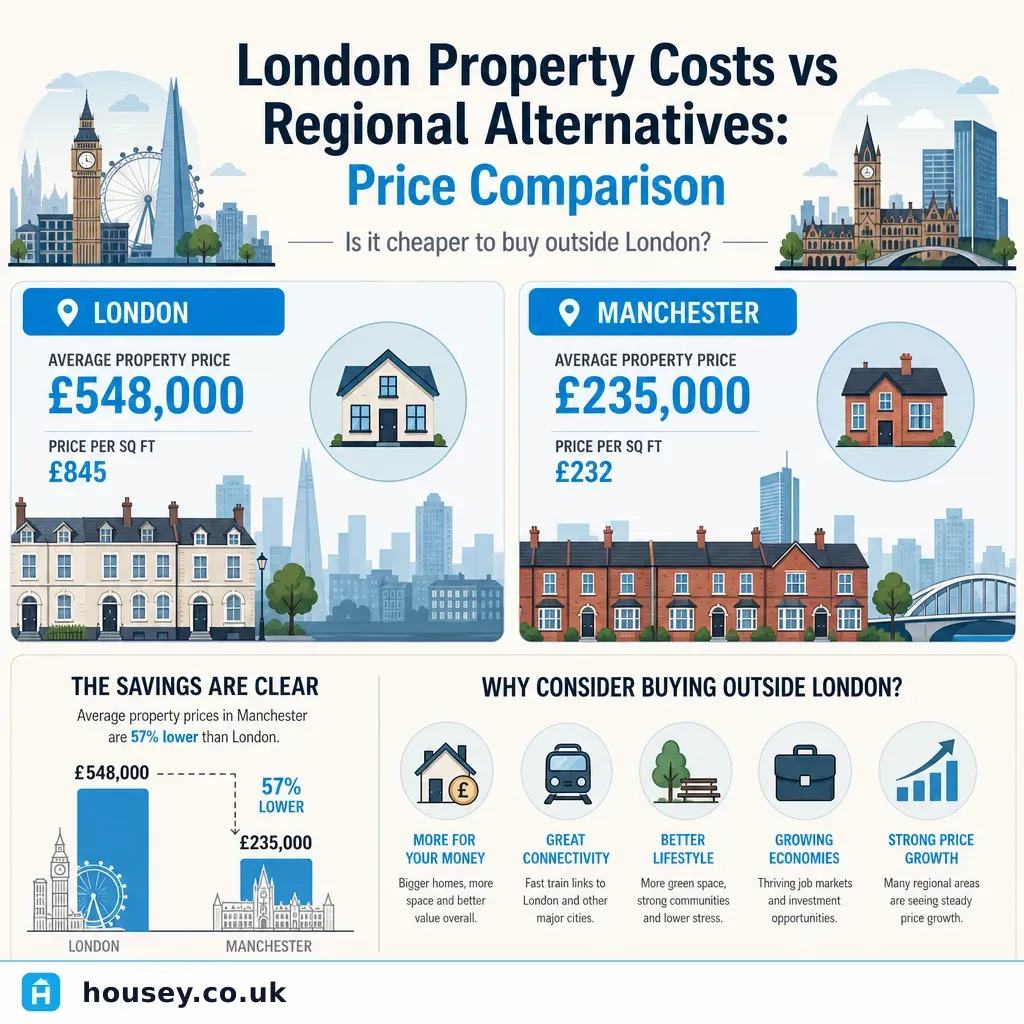
London Property Costs vs Regional Alternatives: Price Comparison
London's average property price is roughly double the UK average and around three times higher than cities such as Manchester, Leeds, and Birmingham.
 General property advice
Market Analysis: How Recent Events Impact Property Asking Prices
UK property asking prices respond to economic events — particularly Bank of England base rate changes, employment data, inflation, and policy shifts such as Stamp Duty thresholds.