Monthly House Price Index: August Market Report and Analysis
By Housey · Last reviewed 18th of May 2026

Monthly House Price Index: August Market Report and Analysis
UK house price data is published monthly by several organisations, each using a different methodology and sample — which is why the ONS UK House Price Index, Halifax, and Nationwide sometimes report different movements for the same period. For buyers and sellers using this data to inform decisions, the August monthly release carries a particular seasonal wrinkle: UK transaction volumes typically fall sharply in July and August as families prioritise the school holidays, meaning August registered completions often reflect sales agreed several months earlier. The gap between what the index measures and what the current market feels like can be significant, and knowing how to read it helps.
Key points
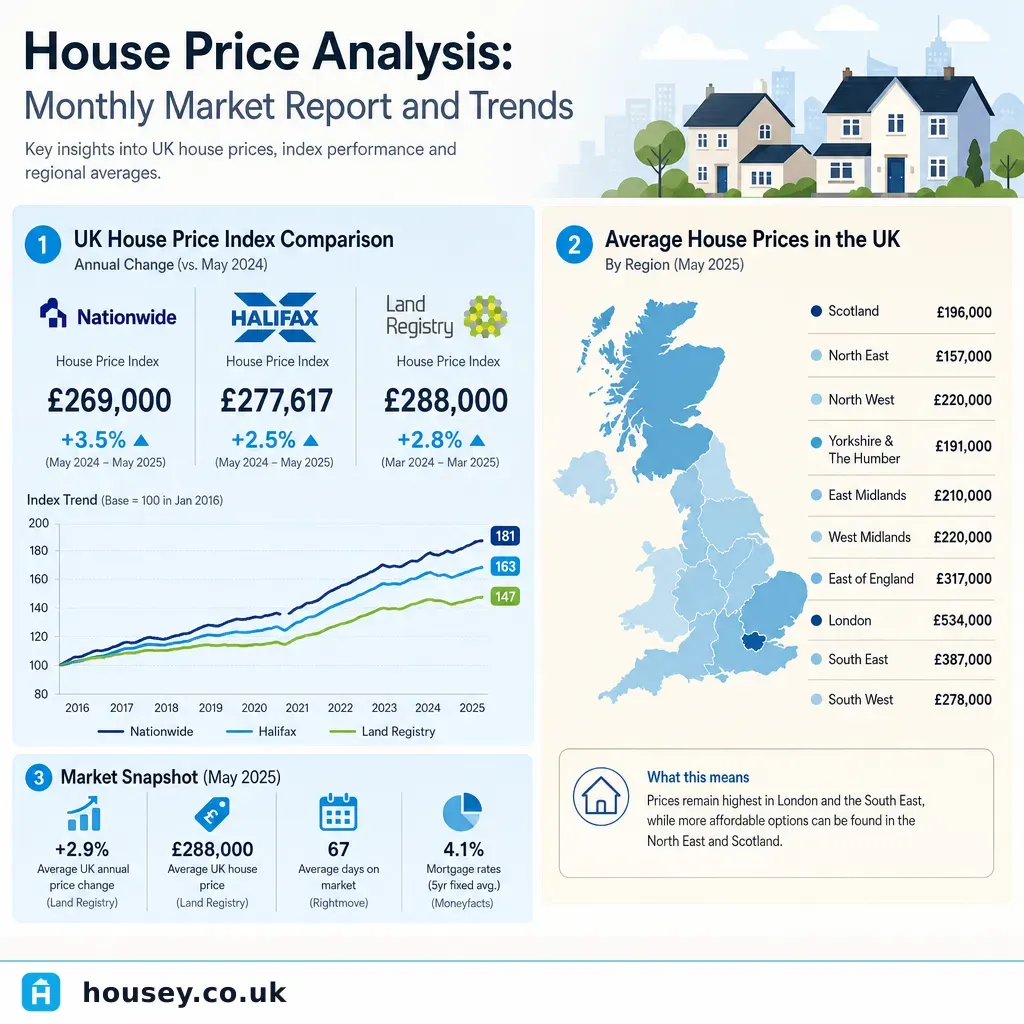
- The ONS UK House Price Index (HPI) is based on all residential property transactions registered at HM Land Registry, making it the most comprehensive measure — but it lags by around two months due to registration timescales.
- Halifax and Nationwide publish monthly house price indices based on their own mortgage approvals data; both are faster to publish but drawn from each lender's own book rather than the whole UK market.
- The UK residential property market typically sees lower transaction volumes in July and August, followed by a seasonal pickup in September and October as buyers and sellers return from summer.
- Asking prices tracked by Rightmove and Zoopla represent listed prices, not agreed or completed prices — these are distinct measures at different stages of the transaction process.
- Nationally reported average price changes can mask significant regional divergence; the ONS UK HPI publishes regional breakdowns for England, Wales, Scotland, and Northern Ireland separately.
Which house price index should you follow?
Index | Publisher | Data source | Typical publication lag | Best for |
|---|---|---|---|---|
UK House Price Index | ONS and HM Land Registry | All registered residential sales | Around 2 months | Accurate historical benchmarking; regional breakdowns |
Halifax HPI | Halifax (Lloyds Banking Group) | Halifax mortgage approvals | Around 1 month | Early-direction indicator; long historical series |
Nationwide HPI | Nationwide Building Society | Nationwide mortgage approvals | Around 1 month | Early-direction indicator; longest UK series (from 1952) |
Rightmove Asking Price Index | Rightmove | Portal listings (asking prices) | Current month | Seller sentiment; listing activity |
RICS Residential Market Survey | RICS | Surveyor and agent sentiment | Current month | Forward-looking demand and supply signals |
For most buyers and sellers, the ONS UK HPI offers the most reliable long-term view of completed sale prices. The Halifax and Nationwide indices are useful for sensing recent market direction but reflect only mortgage-funded transactions within those lenders' books. Cash buyers — who typically account for around 30% of UK residential transactions — are not captured in lender-based indices until completion and registration with HM Land Registry.
What August market data typically tells you
August is one of the quietest months for UK residential property transactions. Families with school-age children are unlikely to exchange during the summer holidays, and many solicitors, surveyors, and estate agents operate at reduced capacity. Several seasonal patterns are worth understanding:
- Transaction volumes typically fall in July and August relative to spring and autumn peaks.
- Asking prices often dip slightly in August as motivated sellers adjust prices ahead of the autumn market.
- Completed sales registered in August tend to reflect sales agreed in May and June — an August HPI print captures conditions from earlier in the year, not the market conditions that follow in autumn.
- The autumn pickup: September and October historically see a surge in new listings and agreed sales as buyers and sellers re-engage after summer. By the time August data is published, the market has often already moved on.
Reading an August HPI report without this seasonal context risks drawing conclusions from data that is already several months out of date.
What not to assume about monthly house price index data
Monthly HPI headlines can be misleading without context. Several common assumptions lead buyers and sellers to misread the data:
Annual rates versus monthly rates: A monthly change of +0.5% extrapolated over twelve months produces a 6% annual figure. Press releases often highlight whichever timeframe looks more significant. Always check whether a headline figure is monthly or annual before drawing conclusions.
National averages mask regional variation: The ONS UK HPI publishes regional breakdowns that frequently diverge from national figures. Average UK house price movements can conceal very different trends between London, the South East, the North of England, Wales, and Scotland. Local authority-level data provides even more granular context for specific buying or selling decisions.
Mean prices are not the same as median prices: Indices using arithmetic averages can be distorted when the mix of property types completing in a given month shifts. A higher proportion of expensive homes completing in August can push the mean upward even if individual properties are not selling for more.
Asking prices are not sale prices: Figures from Rightmove and Zoopla measure listed prices, not agreed or completed transactions. Agreed sale prices and registered completed prices recorded at HM Land Registry can differ materially from asking prices, particularly in softening markets where negotiation and discounting are more common.
A flat month does not mean a static market: A 0.0% monthly change means that average prices happened to be similar to the previous month — not that nothing is moving. Check the RICS Residential Market Survey for forward-looking indicators such as new buyer enquiries and new vendor instructions, which signal direction before transactions complete and register.
What this means for buyers and sellers
If you are buying:
- Use regional HPI data to understand whether your target area has been rising, falling, or stable over the past six to twelve months.
- Do not wait for a specific HPI reading to make a purchase decision — the index reflects past transactions, not the future sale price of the home you are considering.
- August can occasionally produce motivated sellers with fewer competing offers, but also fewer properties to choose from — weigh both sides.
If you are selling:
- Base your asking price on local comparable evidence — recently sold prices for similar property types nearby — not on a national HPI headline.
- August listings may attract fewer viewers but can capture buyers committed to moving before the autumn school term.
- A price adjustment in August can reset the days-on-market count ahead of a September relaunch, which some estate agents recommend as a tactical approach in slower periods.
A worked UK property scenario
A buyer in Birmingham tracks the market in August and reads a national headline reporting a 0.2% monthly fall in average UK house prices. That same week, their estate agent tells them a three-bedroom semi-detached on a specific street went to sealed bids with four offers received.
These two pieces of information are not contradictory. National average data does not override hyperlocal supply and demand. The buyer focuses instead on HM Land Registry sold prices for comparable properties on the same street and of the same property type over the past three to six months — a far more relevant data set for making a competitive offer than a national index figure.
When to get professional help
Monthly HPI data is background context for market understanding, not a substitute for evidence-based professional advice when making significant financial decisions. Seek professional guidance when:
- Setting a purchase offer: A RICS Red Book valuation from a RICS-registered valuer provides an objective, evidenced figure for the specific property.
- Selling: An estate agent's market appraisal should be grounded in local sold prices from HM Land Registry, not national HPI averages.
- Remortgaging: Your lender will commission their own valuation; you can cross-reference using HM Land Registry Price Paid Data for nearby recent sales.
- Buying at auction: Always obtain an independent valuation before bidding — auction pricing can diverge sharply from HPI benchmarks.
How Housey can help
Housey makes it straightforward to connect with vetted professionals for property valuations and related advice. Whether you are preparing to sell, planning a purchase, or reviewing the value of your current home, explore the Housey services directory to compare quotes from qualified local professionals who can provide evidence-based assessments rather than index-based estimates.
Frequently asked questions
Why do Halifax, Nationwide, and the ONS sometimes show different figures?
Each index uses different source data and methodology. Halifax and Nationwide draw on their own mortgage approvals and apply mix-adjustment models; the ONS UK HPI uses all registered completed sales across the whole market. They measure different populations at different points in the transaction process, so short-term divergence is common. Over longer periods, the indices tend to track in the same direction.
Is August a good time to buy or sell property in the UK?
August typically offers lower transaction volumes than spring or autumn, which can benefit buyers facing less competition or sellers with fewer competing listings. Motivated sellers may accept lower offers; motivated buyers may find fewer properties available. Neither August nor any single month is universally advantageous — individual circumstances and hyperlocal supply and demand matter far more than seasonal timing.
Where can I find UK house price data for free?
The ONS UK HPI is published free each month on GOV.UK. HM Land Registry Price Paid Data, covering every registered residential transaction in England and Wales, is freely downloadable. Rightmove and Zoopla publish asking price commentary on their news sections. RICS publishes a monthly Residential Market Survey summarising agent sentiment across the UK.
How far back does UK house price data go?
The Nationwide HPI has one of the longest continuous series, dating to 1952. The ONS UK HPI in its current form began in 2016. HM Land Registry Price Paid Data covers all registered transactions in England and Wales from January 1995 onwards and is freely downloadable in bulk for research purposes.
Sources and further reading
- ONS UK House Price Index — Office for National Statistics
- HM Land Registry Price Paid Data — HM Land Registry
- RICS Residential Market Survey — RICS
- Nationwide House Price Index — data download — Nationwide Building Society
- Rightmove House Price Index — Rightmove
Useful next reads
 General property advice
Market Analysis: How Recent Events Impact Property Asking Prices
UK property asking prices respond to economic events — particularly Bank of England base rate changes, employment data, inflation, and policy shifts such as Stamp Duty thresholds.
 General property advice
House Price Analysis: Monthly Market Report and Trends
UK house prices are tracked by several major indices — the HM Land Registry UK House Price Index, the ONS House Price Index, and lender-based measures from Nationwide and Halifax.
 General property advice
UK Property Prices: Understanding Market Dynamics
UK house prices are driven by mortgage affordability, housing supply, employment levels, and policy decisions such as stamp duty changes.
 General property advice
Property Market Trends: Activity Growth and Price Movements
UK property market activity is measured through completed sale registrations (HM Land Registry), lender mortgage data, and transaction volumes from HMRC.
 General property advice
Property Price Movement: Record-High Asking Prices in the Current Market
UK asking prices reflect what sellers hope to achieve when listing a property, not what buyers necessarily pay.