Property Market Trends: Activity Growth and Price Movements
By Housey · Last reviewed 10th of May 2026

Property Market Trends: Activity Growth and Price Movements
Understanding where the UK housing market stands matters whether you are preparing to sell, deciding when to buy, or making sense of a valuation. Market conditions affect how long properties sit unsold, how much negotiating room buyers hold, and whether an asking price reflects genuine demand or seller optimism. Knowing how market data is collected and what it actually measures helps you read the signals more accurately.
Key points
- The HM Land Registry UK House Price Index (UK HPI) is the official benchmark, using actual completed sale prices — not asking prices or mortgage valuations.
- Transaction volumes (the number of sales registered monthly) are often a more reliable forward indicator of market health than average prices alone.
- Bank of England mortgage approval data leads completed sales by roughly six to eight weeks, providing an early signal of buyer demand.
- Regional variation is significant: average prices in London and the South East routinely diverge from Wales, the North East, and Scotland by tens of thousands of pounds.
- The ratio of achieved sale price to original asking price — tracked by Rightmove and Zoopla — signals whether the market favours buyers or sellers in a given period.
How UK property market data is measured
The UK does not have a single authoritative market report. Several organisations track house prices and activity using different methodologies, which is why published figures sometimes appear to contradict one another.
Index | Publisher | Data source | Publication lag | What it measures |
|---|---|---|---|---|
UK House Price Index (UK HPI) | HM Land Registry / ONS | Completed registered sales | 2–3 months | Final sale prices across England, Wales, Scotland, Northern Ireland |
Nationwide House Price Index | Nationwide Building Society | Mortgage approvals | ~1 month | Mortgaged residential sales (excludes cash buyers) |
Halifax House Price Index | Lloyds Banking Group | Halifax mortgage offers | ~1 month | Mortgaged residential sales only |
Rightmove Asking Price Index | Rightmove | New property listings | Near real-time | Asking prices, not achieved sale prices |
RICS Residential Market Survey | RICS | Member surveyor sentiment | Monthly | Forward-looking buyer/seller balance and price expectations |
The UK HPI is the most comprehensive because it includes cash purchases and covers all tenures. Lender indices publish faster but exclude the roughly one-third of buyers who purchase without a mortgage. Rightmove data is useful for tracking vendor expectations but should not be treated as evidence of achieved prices.
Understanding price movements alongside transaction volumes
Price movements in isolation can be misleading. When few properties change hands, small shifts in the mix of what sells — for example, more detached homes completing and fewer flats — can push the average upward even if no individual property has increased in value.
A worked UK property scenario: If 120,000 transactions complete in a quarter and the average price rises 2%, that is a meaningfully different signal from a 2% rise in a quarter with only 70,000 transactions. The first suggests broad demand across the market; the second may reflect a skewed sample of transaction types rather than genuine market-wide price growth.
HMRC publishes monthly residential transaction data, with Stamp Duty Land Tax receipts for England and Northern Ireland providing a useful proxy for completed activity. Sustained increases in completed transactions — not merely listed properties — generally indicate genuine buyer demand rather than elevated seller activity alone.
Regional differences across UK property markets
National averages routinely conceal dramatically different conditions across the four nations and English regions.
- London and the South East: High absolute prices and greater sensitivity to mortgage rate changes due to larger loan-to-value ratios. Investor and buy-to-let activity influences these markets more than elsewhere.
- North West, Yorkshire, and the Humber: Generally more affordable, with stronger transaction volumes relative to population and historically less volatile price movement.
- Scotland: A separate legal system — missives rather than exchange of contracts — and separate land registration through Registers of Scotland. Land and Buildings Transaction Tax (LBTT) applies rather than SDLT.
- Wales: Land Transaction Tax (LTT) rather than SDLT; the Welsh Government sets its own first-time buyer thresholds and relief rates.
- Northern Ireland: Separate land registration; price growth has historically lagged England but has accelerated in some periods.
Always check regional UK HPI data before drawing conclusions about a specific postcode. Local RICS surveyors and Propertymark estate agents can add context that national figures cannot provide.
Economic indicators that influence house prices
Property prices do not move in isolation. Several economic variables consistently affect buyer demand and seller behaviour:
- Bank of England base rate: Directly affects mortgage affordability. The Monetary Policy Committee typically meets eight times per year. Sustained rises reduce borrowing capacity and tend to dampen prices, particularly at higher price points.
- Mortgage approval volumes (Bank of England): Rising approvals tend to precede price increases by around two months; falling approvals can signal softening demand ahead of official price data.
- Earnings growth (ONS Average Weekly Earnings): When wages outpace house prices, affordability improves. When prices outpace wages, first-time buyer demand weakens and the market can stall at the lower end of the price distribution.
- Consumer confidence (GfK index): A leading indicator for major financial decisions. Sharp falls in confidence often precede reduced market activity.
- Planning permissions and new build starts (MHCLG): Supply additions affect price pressure in specific local markets over the medium term, particularly where demand consistently outstrips available stock.
Red flags when interpreting market data
Not all market commentary is equally reliable. Watch for these common sources of distortion:
- Asking prices presented as sale prices. Rightmove figures reflect vendor expectations. The gap between asking and achieved prices widens significantly in a cooling market.
- Cherry-picked timeframes. A claim of "prices up 15% over five years" may conceal a fall over the most recent 18 months. Always check the base date and endpoint of any comparison.
- National figures applied to local decisions. A national average can mask postcode-level variation of 50% or more. Local UK HPI data is a far better basis for property-specific decisions.
- Seasonally unadjusted monthly comparisons. UK market activity is consistently lower in January and August — month-on-month figures without seasonal adjustment can exaggerate apparent swings.
- Percentage changes on small transaction bases. Rural villages or specialist property types can show dramatic percentage movements from just a handful of completed sales — statistically unreliable as a signal.
When to get professional help
Market data provides useful context but cannot substitute for a professional opinion on your specific property. Consider engaging a qualified professional when:
- You are disputing a surveyor's mortgage valuation and believe local comparable evidence supports a different figure.
- You are deciding between selling now and waiting, and the decision is time-sensitive for tax or inheritance reasons.
- You are buying in an unfamiliar area and need independent commentary on local supply, demand, and price trajectory.
An RICS-registered valuer or a Propertymark estate agent can provide market context specific to your property type and postcode — something no national index can replicate.
How Housey can help
Housey connects UK homeowners and buyers with verified local professionals. Whether you need a property valuation, a survey before purchase, or an independent assessment of your home's condition and market position, Housey helps you request quotes from qualified providers and compare them in one place.
Frequently asked questions
What is the most reliable source for UK house price data?
The HM Land Registry UK House Price Index (UK HPI) is widely regarded as the most comprehensive source because it uses completed sale prices across all tenure types, including cash purchases. Lender indices such as Nationwide and Halifax are published more quickly but cover only mortgage-funded purchases, which represent around two-thirds of UK residential sales.
Why do different house price indices show different figures at the same time?
Each index uses a different data source and methodology. The UK HPI lags by two to three months as it is based on completed Land Registry registrations. Lender indices use mortgage offer data, which is faster but narrower in scope. Rightmove tracks new listing asking prices, not achieved prices. These differences are methodologically expected, not errors.
Does a rising UK average mean my property is worth more?
Not necessarily. Changes in the mix of what sells — more detached homes, fewer flats — can shift the average without any individual property changing in value. A formal valuation from an RICS-registered valuer based on comparable completed local sales gives you a more reliable figure than index data alone.
How does the Bank of England base rate affect house prices?
A higher base rate increases mortgage costs, reducing how much buyers can borrow. This tends to dampen demand and put downward pressure on prices, particularly at higher price points. The effect varies by local market, buyer mix, and how long higher rates persist.
Where can I find regional UK house price data?
The HM Land Registry UK HPI portal provides downloadable data by region, county, and local authority for England and Wales. Registers of Scotland publishes equivalent data for Scottish sales. The ONS publishes house price statistics for small areas enabling postcode-level analysis in many cases.
Sources and further reading
- UK House Price Index reports — HM Land Registry / ONS
- Monthly property transactions completed in the UK — HMRC
- Mortgage Lenders and Administrators Statistics — Bank of England
- RICS Residential Market Survey — RICS
- House price statistics for small areas — ONS
Useful next reads
 General property advice
Property Price Movement: Record-High Asking Prices in the Current Market
UK asking prices reflect what sellers hope to achieve when listing a property, not what buyers necessarily pay.
 General property advice
Monthly House Price Index: August Market Report and Analysis
The UK House Price Index is published monthly using completed Land Registry transaction data, meaning August figures typically reflect sales agreed months earlier.
 General property advice
Scottish Property Market: Activity and Regional Trends
Scotland's property market operates under distinct legal rules: sellers must provide a Home Report before marketing, transactions become legally binding at conclusion of missives rather than exchange of contracts, and Land and Buildings Transaction Tax replaces Stamp Duty.
 General property advice
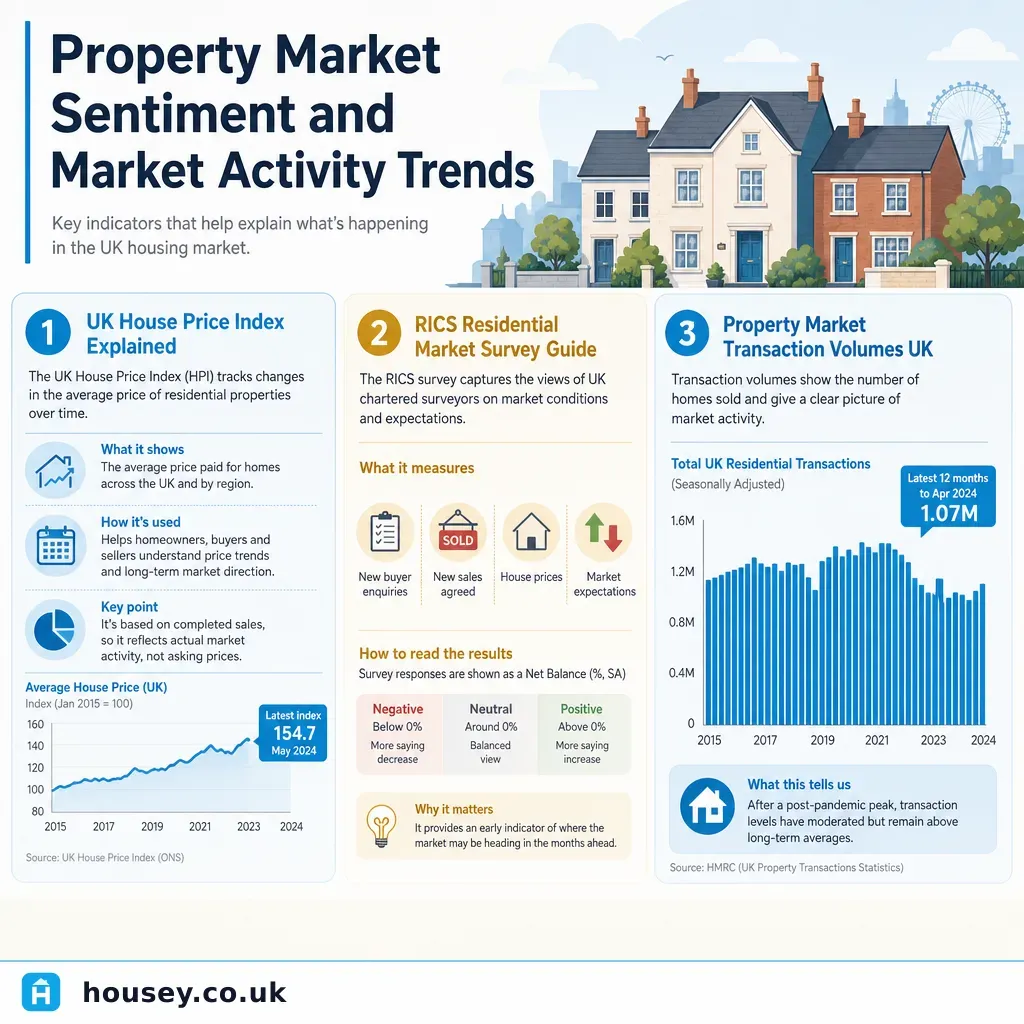
Property Market Sentiment and Market Activity Trends
UK property market sentiment is tracked primarily through the monthly RICS Residential Market Survey, which measures buyer enquiries, agreed sales, and price expectations.
 General property advice
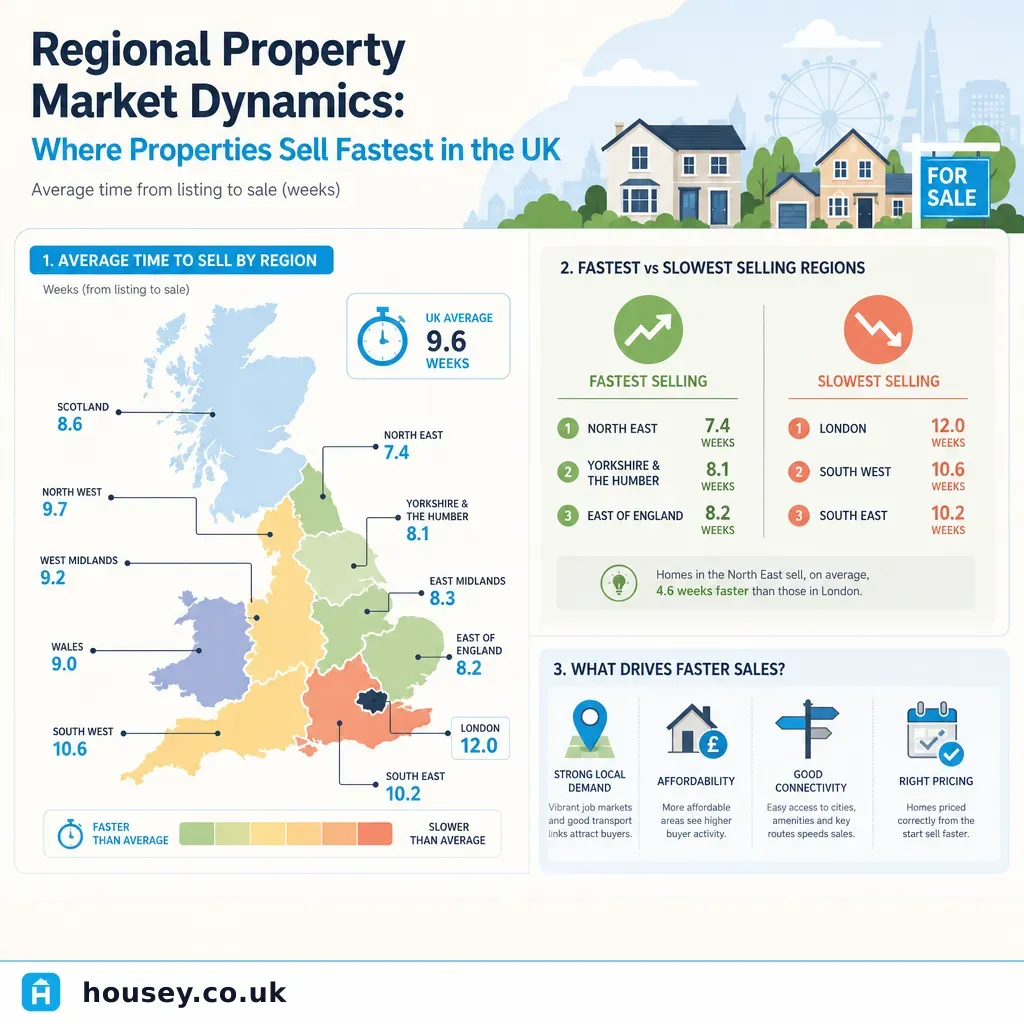
Regional Property Market Dynamics: Where Properties Sell Fastest in the UK
Properties in northern English cities such as Manchester and Leeds have often shown shorter average listing-to-sale times than the national average, though this varies by price bracket, property type, and local stock levels.