UK Property Prices: Understanding Market Dynamics
By Housey · Last reviewed 10th of May 2026
UK Property Prices: Understanding Market Dynamics
For anyone buying, selling, or simply tracking the value of their home, understanding what drives UK house prices matters at every decision point — when an asking price surprises you, a valuation comes in lower than expected, or you are trying to time a move in an uncertain market. The UK residential market operates at national, regional, and intensely local levels simultaneously, and confusing headline averages with neighbourhood reality is one of the most common planning errors homeowners and investors make.
Key points
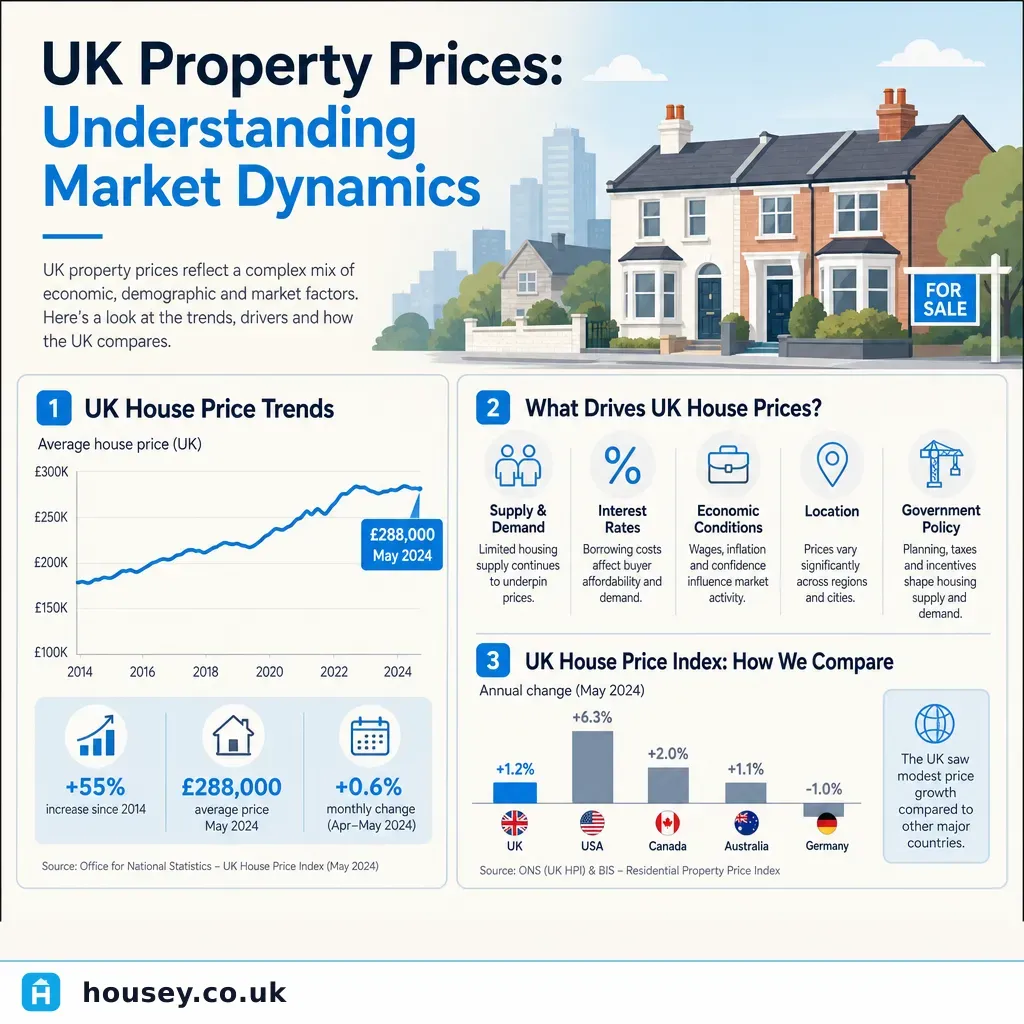
- UK average house prices are tracked by HM Land Registry, the ONS, Halifax, and Nationwide, each using a different methodology — published figures regularly diverge as a result, sometimes by several percentage points.
- The Bank of England base rate influences mortgage affordability, but fixed-rate mortgage pricing is shaped by swap rates, which are forward-looking; base rate changes transmit to the mortgage market with a lag.
- England has consistently built fewer than the government target of 300,000 new homes annually, creating a structural supply shortfall that underpins long-run price resilience despite short-term demand fluctuations.
- Stamp Duty Land Tax (SDLT) in England and Northern Ireland, Land Transaction Tax (LTT) in Wales, and Land and Buildings Transaction Tax (LBTT) in Scotland apply different rates and thresholds, each affecting buyer demand differently.
- The house-price-to-earnings ratio has been significantly above its long-run UK average in recent years, constraining demand particularly for first-time buyers without existing equity.
What drives UK house prices
House prices are shaped by the interaction of supply, demand, credit conditions, and policy. The main drivers:
Driver | Effect when rising | Effect when falling | UK-specific note |
|---|---|---|---|
Bank of England base rate | Downward pressure on prices | Upward pressure on prices | Fixed-rate mortgages priced off swap rates; changes transmit with a lag |
New housing completions | Downward pressure | Upward pressure | UK completions rarely meet government targets |
Unemployment | Downward pressure | Upward pressure | Regional labour markets vary significantly |
Wage growth | Upward pressure (improves affordability) | Downward pressure | House-price-to-earnings ratio is the key long-run affordability metric |
Buy-to-let demand | Upward pressure | Downward pressure | Sector sensitive to SDLT surcharge and mortgage interest deduction changes |
How different indices measure house prices
HM Land Registry HPI: Based on all completed registered transactions. Most comprehensive but lags completions by six to eight weeks.
ONS UK House Price Index: Combines Land Registry, Registers of Scotland, and Land Registry Wales data. Monthly release; widely used for policy and research purposes.
Nationwide and Halifax indices: Based on each lender's own mortgage approvals. Faster to publish but exclude cash buyers and reflect only that lender's lending book. Short-term divergence between the two is common.
Rightmove Asking Price Index: Based on listed prices, not completed sales — a leading indicator of vendor sentiment, not a record of what buyers actually paid. Asking prices can be set aspirationally.
For most homeowners, the HM Land Registry and ONS indices are the most robust measures of transacted prices. Nationwide and Halifax are useful for reading near-term market direction.
What not to assume about property market analysis
- "Prices are falling" does not mean your property has lost value. National indices can move independently of a specific local micro-market; a terraced house in Manchester may behave quite differently from a detached home in Surrey.
- Asking prices are not sold prices. Rightmove figures reflect vendor ambition; Land Registry data reflects what buyers actually paid.
- Short-term volatility is often seasonal. Month-on-month fluctuations frequently reflect transaction volume patterns rather than a structural shift in values.
- "Average price" includes all property types. A rising average may reflect a change in the mix of properties sold — more detached homes transacting — not like-for-like value growth.
- Rate cuts do not immediately mean cheaper fixed mortgages. Swap rate movements are often already priced in before the Bank of England announcement.
Regional market differences
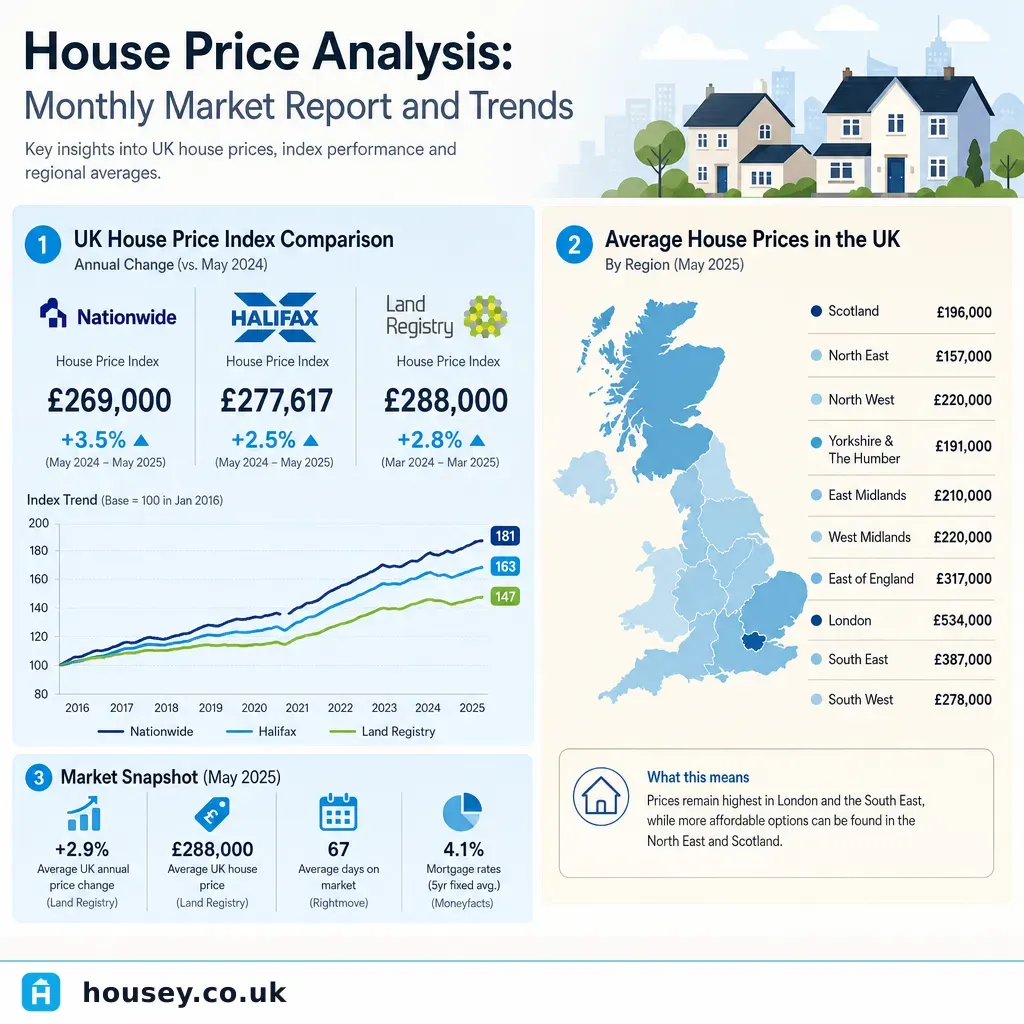
UK property is not one market. London has high average prices but has experienced extended periods of stagnation when affordability is stretched, particularly in the prime central market. The North West, Yorkshire, and East Midlands have lower absolute prices and showed some of the strongest percentage growth post-pandemic. Wales benefited from stamp duty changes and out-of-city migration in 2020–22. Scotland operates under LBTT, and Aberdeen's oil-sector linkage creates cyclicality that can diverge sharply from Edinburgh and Glasgow trends regardless of national conditions.
When to get professional help
General market data provides useful context but does not substitute for specific professional advice:
- Before buying or selling, instruct a RICS-regulated surveyor for an objective assessment — do not rely on an estate agent's indicative valuation alone
- Speak to a whole-of-market mortgage broker before making offers to understand current borrowing capacity at prevailing rates
- Seek independent tax advice before investment decisions — SDLT surcharges, capital gains tax, and rental income tax all affect net returns significantly
- If a mortgage valuation comes in below the agreed purchase price, do not proceed without renegotiating or taking independent advice
How Housey can help
Housey connects homeowners, buyers, and investors with vetted property professionals across the UK — from surveyors before exchange to planning consultants and renovation specialists for improvement projects.
Frequently asked questions
Which UK house price index is most reliable?
The HM Land Registry House Price Index and the ONS UK House Price Index are generally the most comprehensive, based on completed registered sales rather than mortgage approvals or asking prices. They lag the market by several weeks but provide the most accurate record of what buyers actually paid across England, Wales, and Scotland.
Why do Halifax and Nationwide figures sometimes differ?
Both are based on each lender's own mortgage approvals, capturing different borrower profiles and property types. Their methodologies for adjusting property mix also differ slightly. Short-term divergence is common; over longer periods the trends tend to converge with Land Registry and ONS data, which cover all transaction types including cash purchases.
Does a Bank of England rate cut always mean house prices will rise?
Not necessarily. Rate cuts improve affordability and tend to support demand, but economic confidence, employment, housing supply, and existing affordability ratios all influence prices too. Fixed-rate mortgage pricing is shaped by swap rates rather than Bank Rate alone, so the relationship between base rate decisions and house prices is real but not mechanical.
What is the house-price-to-earnings ratio?
This ratio compares average house prices to average gross earnings. A higher ratio indicates homes are less affordable relative to wages, constraining demand at the lower end of the market — particularly for first-time buyers without existing equity. The UK ratio has been significantly above its long-run average in recent years, especially in London and the South East.
Sources and further reading
- UK House Price Index — HM Land Registry
- ONS UK House Price Index — Office for National Statistics
- Monetary Policy Committee decisions — Bank of England
- Nationwide House Price Index — Nationwide Building Society
Useful next reads
 General property advice
Monthly House Price Index: August Market Report and Analysis
The UK House Price Index is published monthly using completed Land Registry transaction data, meaning August figures typically reflect sales agreed months earlier.
 General property advice
Market Analysis: How Recent Events Impact Property Asking Prices
UK property asking prices respond to economic events — particularly Bank of England base rate changes, employment data, inflation, and policy shifts such as Stamp Duty thresholds.
 General property advice
Property Market Trends: Activity Growth and Price Movements
UK property market activity is measured through completed sale registrations (HM Land Registry), lender mortgage data, and transaction volumes from HMRC.
 General property advice
House Price Analysis: Monthly Market Report and Trends
UK house prices are tracked by several major indices — the HM Land Registry UK House Price Index, the ONS House Price Index, and lender-based measures from Nationwide and Halifax.
 General property advice
Property Price Movement: Record-High Asking Prices in the Current Market
UK asking prices reflect what sellers hope to achieve when listing a property, not what buyers necessarily pay.