Property Price Movement: Record-High Asking Prices in the Current Market
By Housey · Last reviewed 18th of May 2026
Property Price Movement: Record-High Asking Prices in the Current Market
Asking prices for UK residential property have repeatedly tested historical highs in recent years, capturing headlines and shaping expectations for buyers and sellers alike. Yet asking prices and the prices properties actually sell for are measured differently, lag by different amounts, and tell different stories about market conditions — a distinction that matters when deciding whether to list, offer, or hold.
Key points
- Asking prices reflect what sellers choose to advertise when listing a property; the ONS/HM Land Registry UK House Price Index (UK HPI) records the price actually paid and registered at Land Registry, and is widely regarded as the most comprehensive measure of achieved UK property prices.
- Rightmove's monthly asking price index is based on new listings added to the portal and typically carries no time lag; the ONS UK HPI reflects completed and registered transactions with a delay of approximately 2–3 months.
- The Bank of England base rate significantly influences mortgage affordability and therefore the ceiling on what buyers can realistically pay — sustained high base rates tend to moderate achieved price growth even when asking prices remain elevated.
- UK property markets vary substantially by region: asking price growth rates in the North West, Yorkshire, and West Midlands have in recent years outpaced those in London and the South East on a percentage basis, driven partly by relative affordability and remote working patterns.
- HM Land Registry's Price Paid Data is publicly searchable and free to use — buyers and sellers can check exactly what comparable nearby properties sold for before making an offer or setting an asking price.
How property price data is measured in the UK
Several indices track UK property prices, each drawing on different data sources and reflecting different points in the transaction cycle. Understanding the distinctions is essential before interpreting any price headline.
Index | Publisher | What it measures | Coverage | Typical lag |
|---|---|---|---|---|
UK House Price Index (UK HPI) | ONS / HM Land Registry | Registered sale prices (all transactions) | England, Wales, Scotland, NI | ~2–3 months |
Nationwide House Price Index | Nationwide Building Society | Mortgage approvals (Nationwide only) | UK | ~1 month |
Halifax House Price Index | Halifax / Lloyds Banking Group | Mortgage approvals (Halifax only) | UK | ~1 month |
Rightmove Asking Price Index | Rightmove | New listings on portal | England, Wales, Scotland | Near real-time |
Zoopla House Price Index | Zoopla | Sales agreed and completions | UK | ~1–2 months |
The ONS UK HPI is based on all residential transactions registered at HM Land Registry and is therefore the broadest and most authoritative measure, though its time lag means it reflects events 2–3 months before publication. Lender indices (Nationwide, Halifax) update more quickly but cover only mortgaged purchases from that particular lender's book. Rightmove asking price data is the most current but the most aspirational, reflecting seller intent rather than achieved prices.
What drives asking prices higher?
Several structural and cyclical factors contribute to elevated asking prices in the UK property market.
Supply constraints remain a persistent driver. Planning restrictions, relatively low volumes of new-build completions relative to household formation, and the reluctance of existing owners to list without certainty about their onward purchase all limit the number of homes available at any one time.
Demand-side pressures include sustained household formation, the ongoing need for first-time buyer deposit support, and demographic shifts in where people want to live. The so-called race for space that emerged from 2020 onwards increased demand for larger properties and suburban or rural locations, pushing asking prices in those areas sharply upward relative to city centres.
Mortgage market conditions create a practical ceiling. When fixed-rate products are priced competitively relative to household incomes, buyer capacity increases and prices are supported. When the Bank of England base rate rises and mortgage affordability tightens, price growth tends to moderate even if sellers maintain ambitious asking prices; the result is often longer time on market and eventual reductions.
Regional regeneration and infrastructure investment affect local asking price dynamics. Areas benefiting from transport improvements, major employer relocations, or urban regeneration programmes often show above-average asking price trends relative to the national picture.
What record asking prices mean in practice
For sellers
Record asking prices can encourage homeowners to list at ambitious figures. However, a property sitting unsold for an extended period may require successive reductions, which can signal weakness to buyers and narrow negotiating room. Checking HM Land Registry's Price Paid Data for comparable recently sold properties in the same street or postcode — combined with advice from a local estate agent with recent transaction data — gives a more defensible asking price than a portal algorithm alone.
For buyers
Headline asking price records can feel discouraging, but the market at the level of a specific property in a specific street often diverges significantly from national averages. Comparing the asking price of any property you are considering against actual sold prices for comparable homes in the same area — using the free Land Registry Price Paid Data tool — before making an offer is a practical way to calibrate expectations. In many active UK markets, properties sell at 1–4% below asking price; in slower conditions, reductions of 5–10% or more are not uncommon.
What not to assume
Record asking price headlines come with important caveats that buyers, sellers, and homeowners planning renovation work should keep in mind.
- Do not assume the asking price equals market value. An asking price is the seller's opening negotiating position, not a professional assessment. Only a RICS-registered valuer can provide a formal opinion of market value supported by comparable evidence.
- Do not assume national record figures apply to your target postcode. A national average record may coincide with a flat or falling local market. Regional ONS HPI data and local sold prices from Land Registry are more relevant to any specific purchase or sale.
- Do not assume a lender will lend against the asking price. Mortgage lenders instruct independent valuers; a down-valuation — where the lender's figure falls below the agreed purchase price — can require a larger deposit or renegotiation of the offer before exchange.
- Do not assume a rising market makes renovation expenditure cost-neutral. Higher house prices do not guarantee that money spent on improvements will be recovered on resale. Whether works add value depends on the ceiling price for the property type in that specific area, the quality of the work, and local buyer preferences.
- Do not rely on asking price data alone for financial decisions. For any significant transaction, complement index data with recent sold prices from Land Registry and, where warranted, commission a professional RICS valuation.
UK regional asking price patterns
UK property markets are not uniform, and buyers and sellers in different parts of the country encounter materially different conditions.
- London: Historically the highest absolute asking prices in the UK; percentage growth in asking prices has been more moderate than many other regions in recent years, constrained by affordability at high price points and a shift in demand toward outer boroughs and commuter belt towns.
- North West and Yorkshire: Strong percentage asking price growth driven by relative affordability compared with the South and East, inward migration of remote workers, and urban regeneration in cities such as Manchester, Leeds, and Sheffield.
- South East and East of England: Sustained demand from buyers relocating from London and high baseline values have kept asking prices elevated, though growth rates have varied with changes in mortgage market conditions.
- Scotland: Edinburgh and Glasgow have seen consistent demand, with asking prices in desirable city neighbourhoods and commuter towns performing strongly; rural and island markets show greater volatility linked to lifestyle buyer demand.
- Wales: Post-pandemic demand for rural and coastal properties pushed asking prices sharply upward in parts of mid and west Wales; the Cardiff market has retained strong demand driven by employment growth and transport links.
For current regional data, the ONS UK HPI regional breakdowns, published monthly, are the most reliable reference point.
When to get professional help
If you are making significant financial decisions — whether to buy, sell, renovate, or remortgage — based on property price trends, independent professional input is advisable:
- A RICS-registered valuer can provide a formal market valuation, which is more reliable than portal asking price data as a guide to what a willing buyer would pay today in a specific market.
- A mortgage adviser can model what you can borrow under current product conditions, helping you translate asking prices into realistic affordability scenarios.
- A local estate agent with recent comparable sold data can advise whether a specific asking price is achievable and how long similar properties are currently taking to sell in your area.
How Housey can help
Housey publishes practical guides on buying, selling, and improving UK property to help homeowners make better-informed decisions at each stage of the property lifecycle. For transaction support — including surveys, conveyancing, and renovation services — Housey's marketplace connects you with vetted local professionals who can help you act with confidence in any market.
Frequently asked questions
What is the difference between asking price and sold price in the UK?
Asking price is the figure a seller advertises when listing a property, set by the seller and their estate agent. Sold price is the amount the buyer actually paid, registered at HM Land Registry after completion. In active UK markets, properties typically sell at 1–4% below asking price; in slower conditions, reductions of 5–10% are common. The ONS UK House Price Index tracks sold prices, not asking prices.
Do record asking prices mean now is a bad time to buy?
Not necessarily. Record national asking price averages reflect overall market sentiment, not whether a specific property in a specific postcode represents good value. Comparing the asking price with recent Land Registry sold prices for comparable nearby properties, and commissioning a RICS survey before exchange, will give you a more accurate picture than relying on headline index data alone.
How often is UK asking price data updated?
Rightmove publishes its monthly asking price index typically in the second or third week of each month, reflecting new listings from the previous month. ONS/HM Land Registry UK HPI is published monthly but reflects transactions registered approximately 2–3 months earlier. For the most current local intelligence, checking recently sold prices on the Land Registry Price Paid Data tool or speaking to a local estate agent is advisable.
Which UK property price index should I trust most?
For understanding what properties have actually sold for, the ONS UK House Price Index is generally considered the most comprehensive because it captures all registered transactions, not just mortgaged purchases from a single lender. For current listing sentiment, Rightmove's asking price index is the most timely. For a significant financial decision, a formal valuation from a RICS-registered valuer is more reliable than any index.
Sources and further reading
- UK House Price Index — ONS / HM Land Registry
- HM Land Registry Price Paid Data — HM Land Registry
- Nationwide House Price Index — Nationwide Building Society
- Bank of England base rate decisions — Bank of England
- Rightmove House Price Index — Rightmove
Useful next reads
 General property advice
Property Market Trends: Activity Growth and Price Movements
UK property market activity is measured through completed sale registrations (HM Land Registry), lender mortgage data, and transaction volumes from HMRC.
 General property advice
Market Analysis: How Recent Events Impact Property Asking Prices
UK property asking prices respond to economic events — particularly Bank of England base rate changes, employment data, inflation, and policy shifts such as Stamp Duty thresholds.
 General property advice
Monthly House Price Index: August Market Report and Analysis
The UK House Price Index is published monthly using completed Land Registry transaction data, meaning August figures typically reflect sales agreed months earlier.
 General property advice
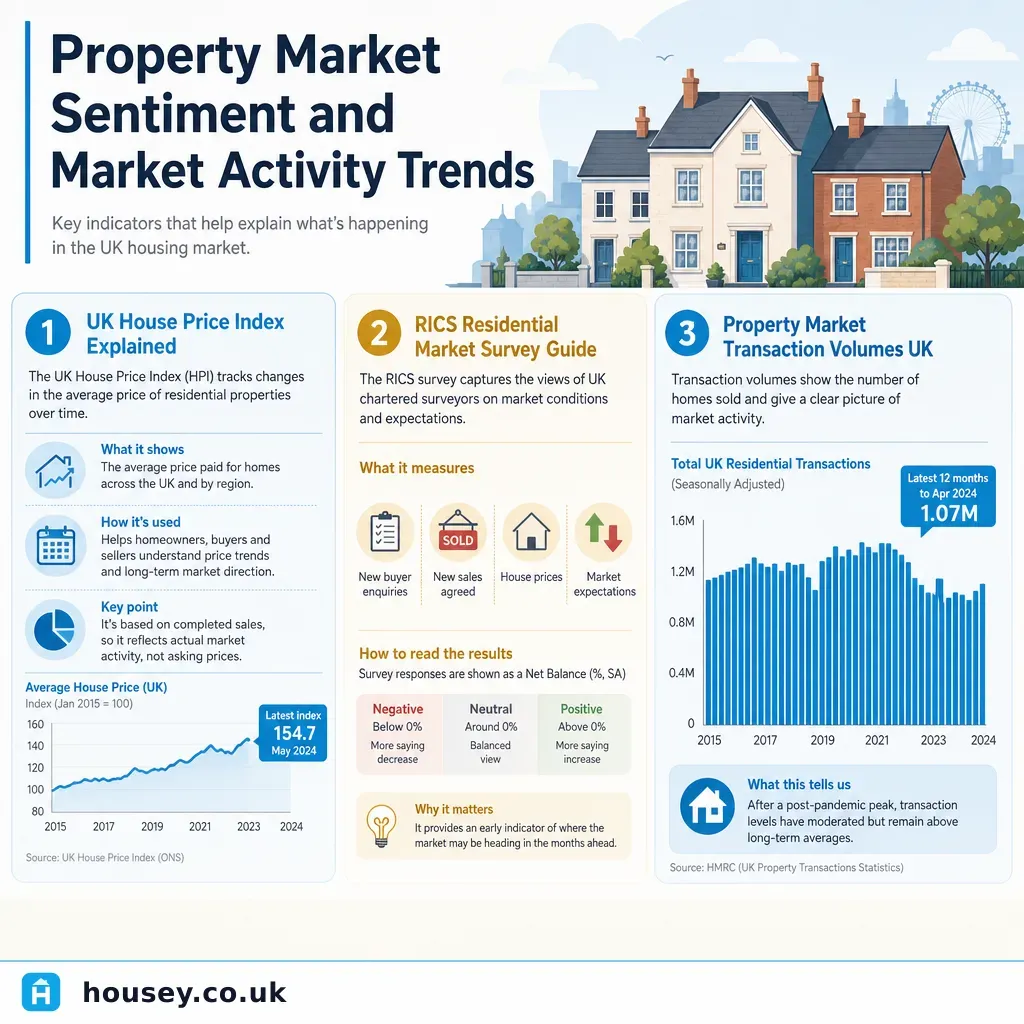
Property Market Sentiment and Market Activity Trends
UK property market sentiment is tracked primarily through the monthly RICS Residential Market Survey, which measures buyer enquiries, agreed sales, and price expectations.
 General property advice
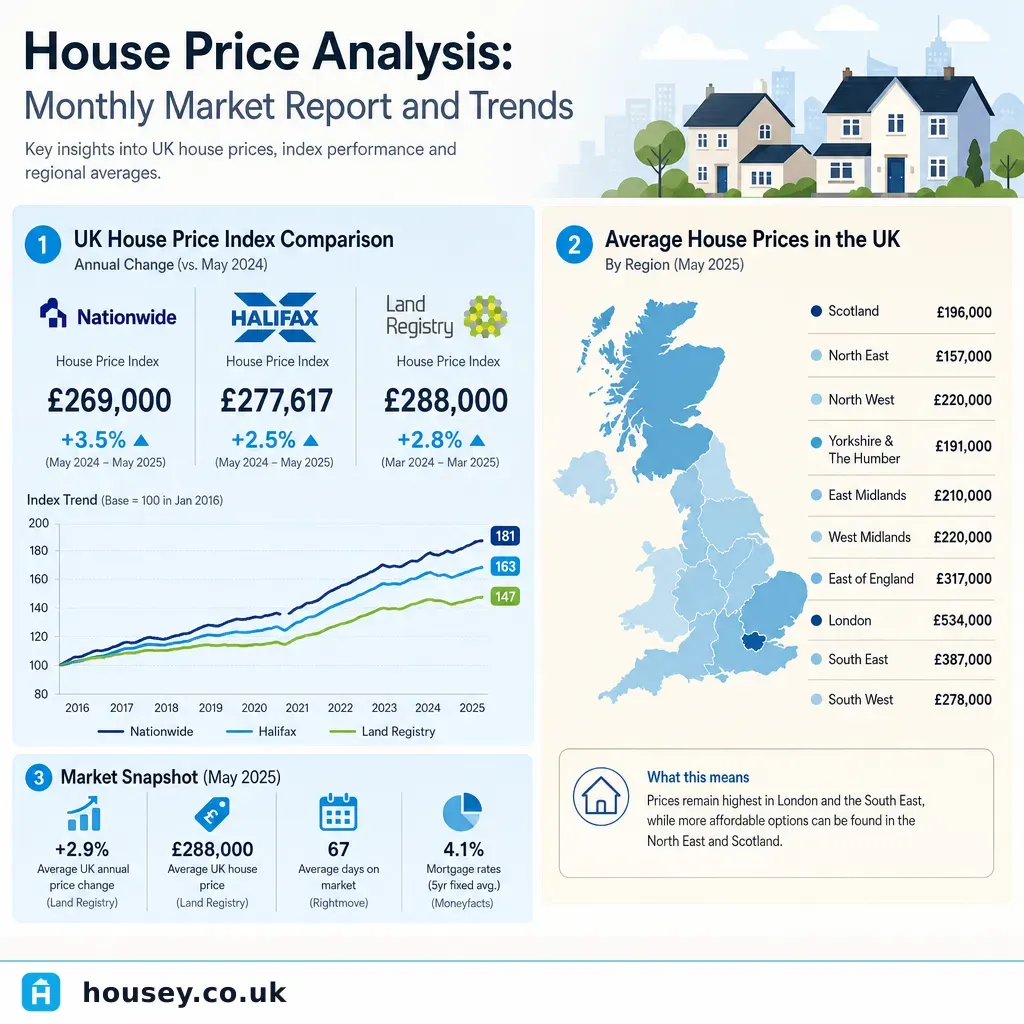
House Price Analysis: Monthly Market Report and Trends
UK house prices are tracked by several major indices — the HM Land Registry UK House Price Index, the ONS House Price Index, and lender-based measures from Nationwide and Halifax.