Property Market Sentiment and Market Activity Trends
By Housey · Last reviewed 9th of May 2026
Property Market Sentiment and Market Activity Trends
Deciding when to buy, sell, or delay a move often involves reading market conditions as accurately as possible — but the UK property market produces a wide range of monthly indicators that can appear to contradict one another. Buyers tracking the RICS Residential Market Survey, HM Land Registry data, and Bank of England mortgage approval figures quickly discover that each measures something different, at a different point in time, with different methodological limitations. Understanding how to interpret and weight these sources is a practical skill for any homeowner planning a UK property transaction.
Key points
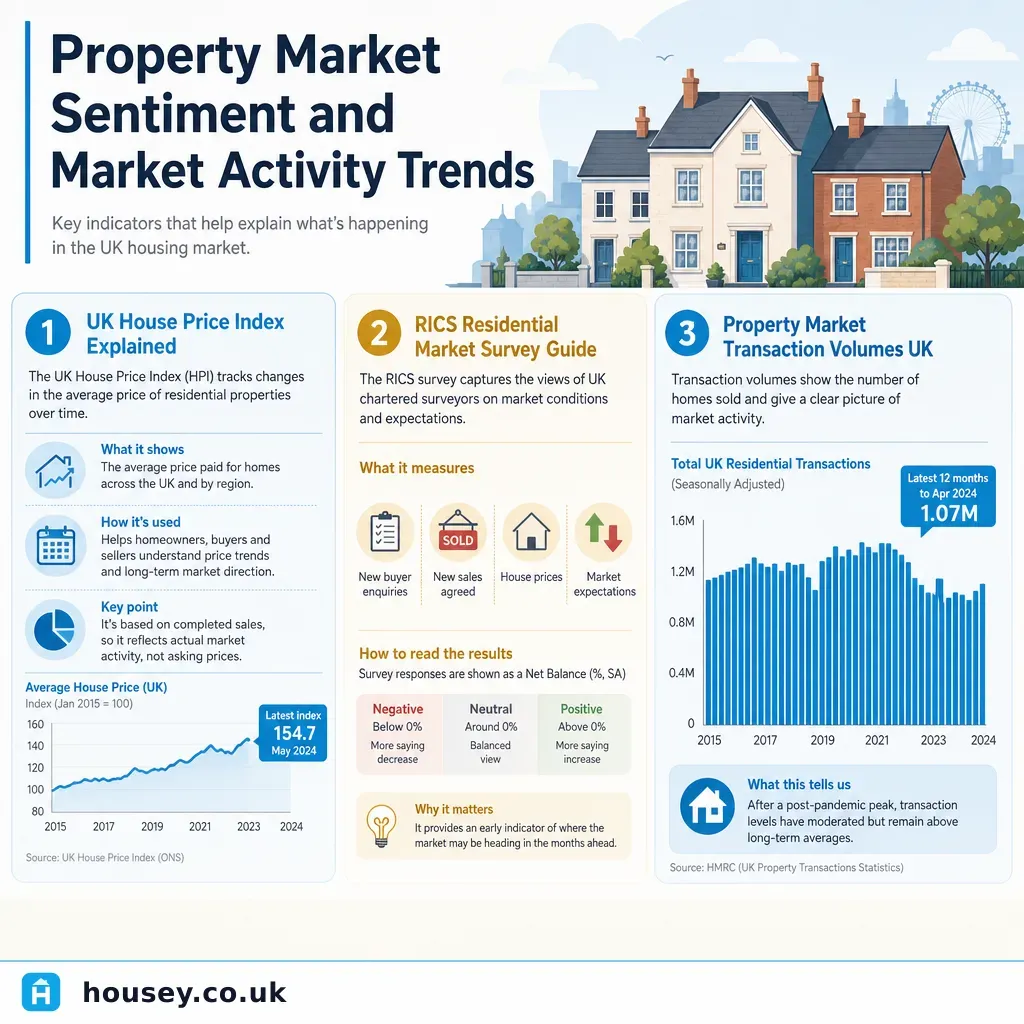
- The RICS Residential Market Survey is a leading sentiment indicator, published monthly, measuring buyer enquiries, agreed sales, and 12-month price expectations — it is not a house price index.
- HM Land Registry's UK House Price Index is based on completed and registered sales and typically publishes with a two-month lag, making it a lagging indicator of market turns.
- HMRC residential transaction statistics count completed property transactions each month, independent of price data, offering a cleaner measure of overall market activity.
- Bank of England mortgage approval data typically leads transaction completions by approximately 2–3 months, because approvals precede exchange and completion in the conveyancing timeline.
- Cash buyers account for approximately 30–35% of UK residential transactions according to HMRC data, meaning mortgage approval figures alone capture only part of total market activity.
What is property market sentiment?
Market sentiment refers to the collective confidence of buyers, sellers, agents, and lenders at a given point in time. In the UK property market, sentiment is measured primarily through two channels.
Survey-based leading indicators ask market participants how they feel about current and future conditions. The most widely cited is the RICS Residential Market Survey, which asks member surveyors and estate agents each month whether buyer enquiries, agreed sales, new instructions, and 12-month price expectations are rising, falling, or static. The resulting net balance figures — the percentage reporting an increase minus those reporting a decrease — provide an early directional signal before it appears in price or transaction data.
Transaction and price data measure what has actually happened: completed sales registered at HM Land Registry, transaction counts published by HMRC, and mortgage approval data from the Bank of England and UK Finance.
The distinction matters in practice: sentiment can shift rapidly following an interest rate decision, a Budget announcement, or a significant economic shock, while transaction and price data reflect decisions made weeks or months earlier.
Key UK property market indicators compared
Indicator | Publisher | Type | Approximate lag | What it measures | Key limitation |
|---|---|---|---|---|---|
RICS Residential Market Survey | RICS | Sentiment (leading) | ~1 month | Buyer enquiries, agreed sales, price expectations | Opinion-based; not a price index |
UK House Price Index | HM Land Registry | Price index (lagging) | ~2 months | Average prices by region and property type | Reflects past activity; slow to signal turning points |
Residential transactions | HMRC | Activity | ~1–2 months | Count of completed residential property transactions | Does not break down by buyer type or tenure |
Mortgage approvals for house purchase | Bank of England | Activity (leading) | Leads completions by ~2–3 months | Approved mortgages for purchase | Excludes cash buyers, roughly 30–35% of the market |
Halifax House Price Index | Halifax | Price index | ~1 month | Average prices from Halifax mortgage approvals | Covers Halifax's lending only, not the whole market |
Nationwide House Price Index | Nationwide | Price index | ~1 month | Average prices from Nationwide mortgage approvals | Covers Nationwide's lending only, not the whole market |
Rightmove Asking Price Index | Rightmove | Asking prices | Real-time | Average asking prices on new listings | Asking prices are not the same as achieved prices |
How to interpret activity and price trends
Rising buyer enquiries (RICS) suggest demand is building ahead of sales volumes; upward price pressure often follows 2–3 months later if new supply of listings does not respond at the same pace.
Falling mortgage approvals (Bank of England) typically precede a drop in completed transactions by roughly one quarter, as approvals lead exchanges and completions in the conveyancing timeline.
Rising transaction volumes (HMRC) without rising prices can indicate the market is recovering in activity terms while buyers and sellers continue to negotiate carefully on price — a common feature of a market recovering from a correction.
Divergence between lender indices and Land Registry data often reflects methodological differences. Lender indices capture approvals primarily for mortgaged properties; Land Registry captures all completed and registered sales, including cash purchases and transactions in price ranges where cash buyers are more prevalent.
Seasonal patterns are significant in UK property. Completions typically peak in spring (March–May) and autumn (September–October) and are suppressed in August and around the Christmas–New Year period. Year-on-year comparisons smooth these patterns; month-on-month figures in isolation can give a misleading impression of trend direction.
What not to assume when reading market data
- Do not assume national data reflects your local market. UK property is deeply local. Price trends in inner London, the North West, and rural Wales can move in opposite directions in the same month. Always cross-reference national data with regional Land Registry breakdowns and local RICS survey figures.
- Do not treat asking prices as achieved prices. The Rightmove Asking Price Index reflects seller aspirations, not negotiated outcomes. The achieved price is what appears in Land Registry data; the gap between asking and achieved varies with market conditions and can be substantial in slower markets.
- Do not assume a sentiment upturn will immediately translate into price rises. Sentiment typically leads price data by several months, and external shocks can reverse sentiment rapidly before any price effect materialises.
- Do not conflate transaction volumes with price direction. Rising transaction volumes can occur during price corrections (as improved affordability draws buyers back) and falling volumes can occur during rising markets (as constrained supply and stretched affordability reduce activity).
- Do not ignore the cash buyer component. Because mortgage approval data excludes cash purchasers, it underrepresents total activity in areas and price bands where cash buying is common — rural markets, higher-value properties, and properties sold at auction.
- Do not rely on a single index. No single indicator captures the full picture. Using two or three complementary sources — a leading sentiment measure, a transaction count, and a lagging price index — gives a more accurate read of market conditions.
How to track UK market conditions
These free, publicly available sources cover the main indicators.
- RICS Residential Market Survey — published monthly at rics.org. The 12-month price expectations net balance and new buyer enquiries balance are the most forward-looking figures to watch.
- HM Land Registry UK House Price Index — published monthly. Filter by region and property type for local relevance.
- HMRC property transaction statistics — published monthly. Year-on-year comparison of non-seasonally adjusted figures is more informative than month-on-month for identifying trends.
- Bank of England Money and Credit release — published monthly, includes mortgage approvals for house purchase, a useful leading indicator of near-term completions.
- Zoopla and Rightmove market updates — useful for real-time supply levels, time-on-market data, and asking price movements. Bear in mind these reflect listing behaviour rather than completed transaction data.
When to get professional help
Market data can inform your decisions but cannot substitute for advice specific to your circumstances.
- If you are making a major financial decision based on market conditions — purchasing, remortgaging, or moving into letting — a qualified, FCA-regulated mortgage broker or independent financial adviser can assess your personal exposure to rate and value risk.
- If you need a formal valuation for sale, probate, or separation proceedings, instruct an RICS-registered valuer (MRICS or FRICS with relevant residential practice experience) rather than relying on automated valuation models (AVMs) or estate agent market appraisals, which are not formal valuations.
- If the data source you are reading has a commercial interest in presenting market conditions positively — such as estate agency portals or lender indices used in marketing materials — weight it accordingly against neutral, official sources such as HMRC and HM Land Registry.
How Housey can help
Housey publishes practical, sourced guides to help UK homeowners and buyers navigate property decisions at every stage of ownership — from understanding market conditions to commissioning surveys, planning works, and finding local professionals. Explore the full range of guides and services at housey.co.uk.
Frequently asked questions
What is the most reliable house price index in the UK?
For completed sales, the HM Land Registry UK House Price Index is the most comprehensive, covering all residential transactions registered in England and Wales rather than a single lender's mortgage book. Nationwide and Halifax indices are published faster but cover only their own mortgage approvals. Cross-referencing Land Registry data with the RICS Residential Market Survey gives the fullest picture of both current conditions and price trends.
How often is UK property market data published?
Most major indicators are published monthly. The RICS Residential Market Survey and lender HPIs (Nationwide, Halifax) typically appear within the first two weeks of the following month. HM Land Registry HPI and HMRC transaction data usually publish with approximately a two-month lag, reflecting the time between transaction completion, registration, and data collation.
What are the main factors that drive UK house prices?
The principal drivers include mortgage interest rates and affordability, employment and real wage growth, housing supply (new build completions and planning permissions granted), net migration, and household formation rates. Government policy changes such as stamp duty adjustments or equity loan schemes can produce short-term shifts. Regional factors including local employment, transport investment, and school quality often outweigh national trends for specific locations.
Is sentiment data more useful than price data for predicting market movements?
Leading sentiment indicators such as RICS buyer enquiries and Bank of England mortgage approvals tend to precede price movements by roughly 2–6 months. Price indices reflect past activity. Neither is a reliable short-term forecasting tool on its own, but combining leading and lagging indicators gives a clearer picture of likely trend direction than relying on either in isolation.
Why do different house price indices show different figures?
Each index measures a different population — Halifax and Nationwide cover only their own mortgage approvals, while Land Registry covers all registered sales including cash purchases. They also capture activity at different transaction stages: approval versus completion. Indices tend to agree on broad trend direction while differing on magnitude. Land Registry data is generally considered the most complete measure, though it is the slowest to publish.
Sources and further reading
- UK House Price Index reports — HM Land Registry
- RICS Residential Market Survey — RICS
- UK residential property transaction statistics — HMRC
- Money and Credit statistical release — Bank of England
- Housing statistics and analysis — DLUHC / GOV.UK
Useful next reads
 General property advice
Property Market Trends: Activity Growth and Price Movements
UK property market activity is measured through completed sale registrations (HM Land Registry), lender mortgage data, and transaction volumes from HMRC.
 General property advice
Property Price Movement: Record-High Asking Prices in the Current Market
UK asking prices reflect what sellers hope to achieve when listing a property, not what buyers necessarily pay.
 General property advice
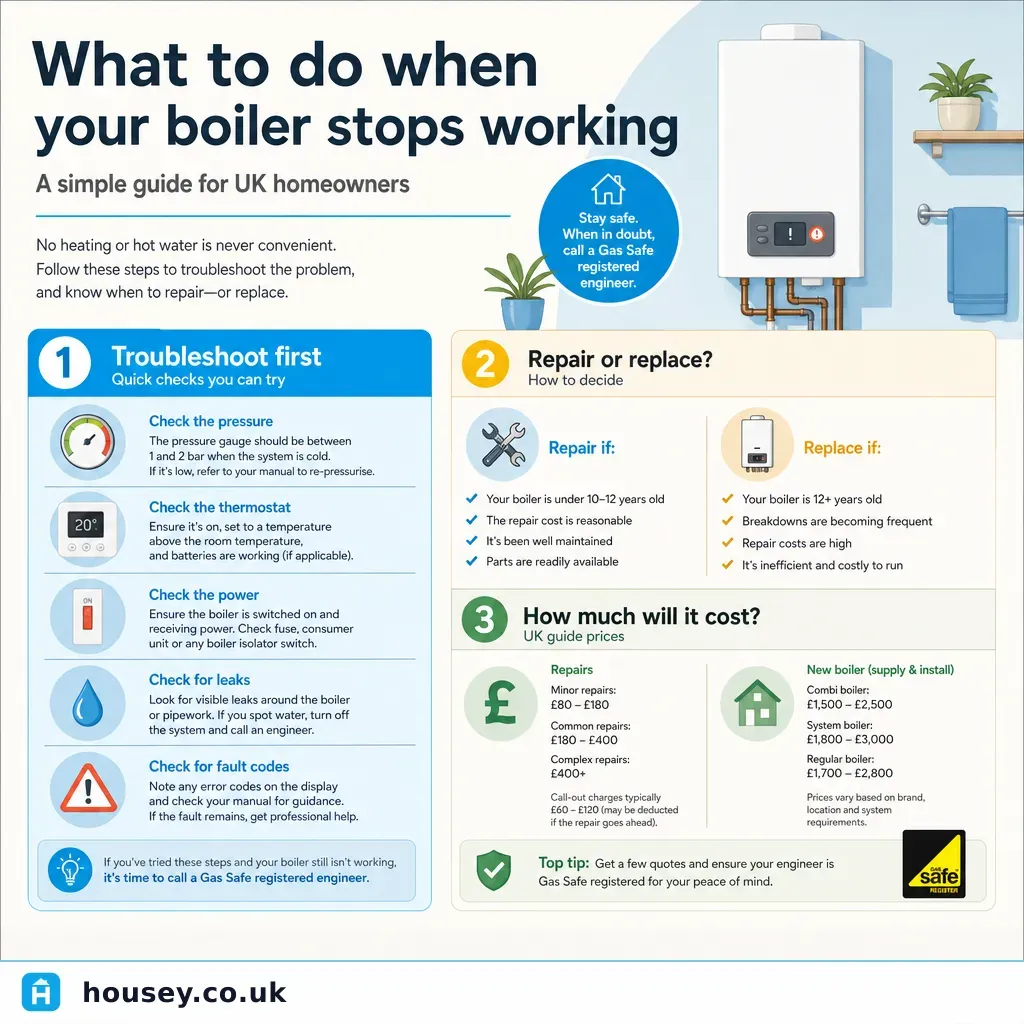
What to do when your boiler stops working
When your boiler stops working, check the pressure gauge (should read 1–1.
 General property advice
Installing a water main shut-off valve for your property
A water main shut-off valve — commonly called a stopcock — controls all water entering your home from the mains.
 General property advice
Monthly House Price Index: August Market Report and Analysis
The UK House Price Index is published monthly using completed Land Registry transaction data, meaning August figures typically reflect sales agreed months earlier.